|
Download Data (XLS File) |
|
||||||||
|
||||||||
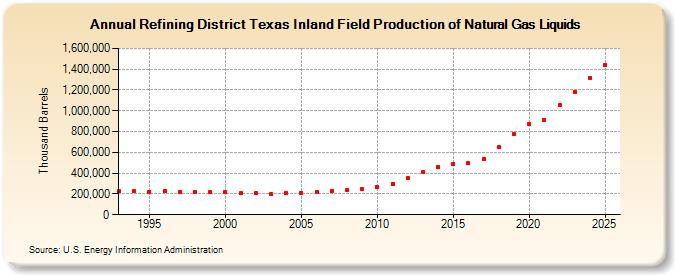
| Refining District Texas Inland Field Production of Natural Gas Liquids (Thousand Barrels) | ||||||||
| Decade | Year-0 | Year-1 | Year-2 | Year-3 | Year-4 | Year-5 | Year-6 | Year-7 | Year-8 | Year-9 |
|---|---|---|---|---|---|---|---|---|---|---|
| 1990's | 226,814 | 224,467 | 221,973 | 225,908 | 220,787 | 220,986 | 215,698 | |||
| 2000's | 215,720 | 206,317 | 209,808 | 196,238 | 210,492 | 212,465 | 220,756 | 228,252 | 232,994 | 244,284 |
| 2010's | 266,619 | 294,313 | 350,787 | 413,008 | 458,338 | 491,293 | 496,438 | 534,311 | 649,265 | 778,243 |
| 2020's | 875,380 | 910,248 | 1,057,377 | 1,155,587 |
| - = No Data Reported; -- = Not Applicable; NA = Not Available; W = Withheld to avoid disclosure of individual company data. |
| Release Date: 3/29/2024 |
| Next Release Date: 8/30/2024 |