|
Download Data (XLS File) |
|
||||||||
|
||||||||
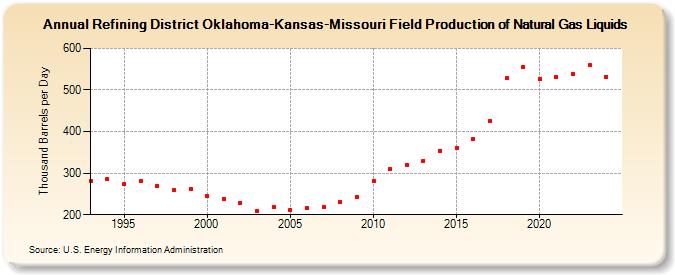
| Refining District Oklahoma-Kansas-Missouri Field Production of Natural Gas Liquids (Thousand Barrels per Day) | ||||||||
| Decade | Year-0 | Year-1 | Year-2 | Year-3 | Year-4 | Year-5 | Year-6 | Year-7 | Year-8 | Year-9 |
|---|---|---|---|---|---|---|---|---|---|---|
| 1990's | 282 | 285 | 273 | 280 | 270 | 259 | 261 | |||
| 2000's | 244 | 238 | 229 | 208 | 218 | 211 | 215 | 219 | 230 | 242 |
| 2010's | 281 | 310 | 320 | 330 | 354 | 360 | 383 | 425 | 528 | 556 |
| 2020's | 526 | 531 | 538 | 558 |
| - = No Data Reported; -- = Not Applicable; NA = Not Available; W = Withheld to avoid disclosure of individual company data. |
| Release Date: 3/29/2024 |
| Next Release Date: 8/30/2024 |