|
Download Data (XLS File) |
|
||||||||
|
||||||||
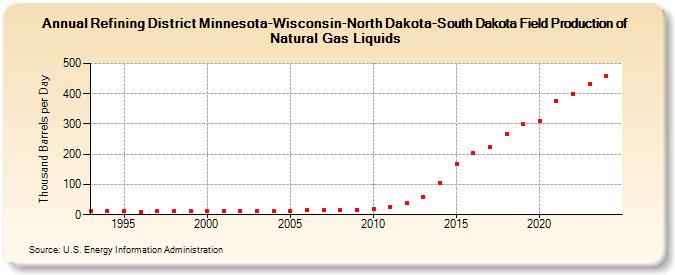
| Refining District Minnesota-Wisconsin-North Dakota-South Dakota Field Production of Natural Gas Liquids (Thousand Barrels per Day) | ||||||||
| Decade | Year-0 | Year-1 | Year-2 | Year-3 | Year-4 | Year-5 | Year-6 | Year-7 | Year-8 | Year-9 |
|---|---|---|---|---|---|---|---|---|---|---|
| 1990's | 12 | 12 | 11 | 10 | 11 | 11 | 12 | |||
| 2000's | 12 | 12 | 12 | 12 | 12 | 13 | 14 | 14 | 14 | 16 |
| 2010's | 20 | 25 | 40 | 57 | 104 | 169 | 204 | 223 | 266 | 299 |
| 2020's | 311 | 375 | 400 | 437 |
| - = No Data Reported; -- = Not Applicable; NA = Not Available; W = Withheld to avoid disclosure of individual company data. |
| Release Date: 3/29/2024 |
| Next Release Date: 8/30/2024 |