|
Download Data (XLS File) |
|
||||||||
|
||||||||
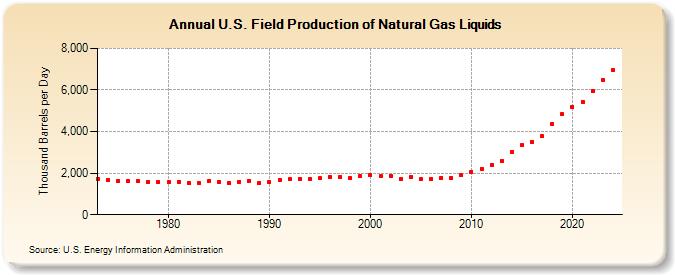
| U.S. Field Production of Natural Gas Liquids (Thousand Barrels per Day) | ||||||||
| Decade | Year-0 | Year-1 | Year-2 | Year-3 | Year-4 | Year-5 | Year-6 | Year-7 | Year-8 | Year-9 |
|---|---|---|---|---|---|---|---|---|---|---|
| 1970's | 1,738 | 1,688 | 1,633 | 1,604 | 1,618 | 1,567 | 1,584 | |||
| 1980's | 1,573 | 1,590 | 1,539 | 1,547 | 1,626 | 1,595 | 1,546 | 1,591 | 1,621 | 1,546 |
| 1990's | 1,559 | 1,659 | 1,697 | 1,736 | 1,727 | 1,762 | 1,830 | 1,817 | 1,759 | 1,850 |
| 2000's | 1,911 | 1,868 | 1,880 | 1,719 | 1,809 | 1,717 | 1,739 | 1,783 | 1,784 | 1,910 |
| 2010's | 2,074 | 2,216 | 2,408 | 2,606 | 3,015 | 3,342 | 3,509 | 3,783 | 4,369 | 4,825 |
| 2020's | 5,175 | 5,425 | 5,933 | 6,431 |
| - = No Data Reported; -- = Not Applicable; NA = Not Available; W = Withheld to avoid disclosure of individual company data. |
| Release Date: 3/29/2024 |
| Next Release Date: 8/30/2024 |