|
Download Data (XLS File) |
|
||||||||
|
||||||||
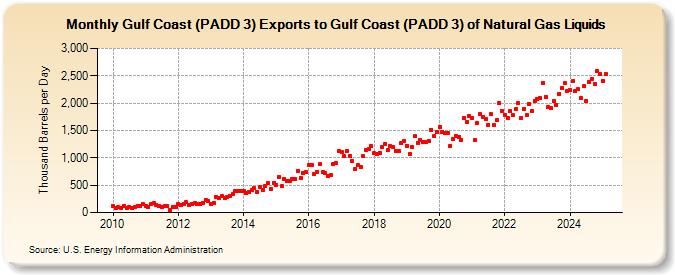
| Gulf Coast (PADD 3) Exports to Gulf Coast (PADD 3) of Natural Gas Liquids (Thousand Barrels per Day) | ||||||||
| Year | Jan | Feb | Mar | Apr | May | Jun | Jul | Aug | Sep | Oct | Nov | Dec |
|---|---|---|---|---|---|---|---|---|---|---|---|---|
| 2010 | 129 | 89 | 93 | 86 | 116 | 81 | 103 | 89 | 109 | 125 | 120 | 153 |
| 2011 | 123 | 96 | 155 | 170 | 140 | 119 | 97 | 115 | 126 | 49 | 110 | 108 |
| 2012 | 150 | 138 | 148 | 187 | 139 | 151 | 171 | 155 | 148 | 182 | 238 | 215 |
| 2013 | 156 | 182 | 280 | 271 | 304 | 264 | 286 | 304 | 332 | 398 | 398 | 399 |
| 2014 | 395 | 349 | 368 | 413 | 444 | 377 | 459 | 414 | 492 | 540 | 435 | 543 |
| 2015 | 508 | 655 | 481 | 616 | 582 | 580 | 620 | 609 | 764 | 632 | 732 | 739 |
| 2016 | 878 | 864 | 708 | 744 | 884 | 733 | 725 | 672 | 683 | 895 | 899 | 1,131 |
| 2017 | 1,105 | 1,030 | 1,133 | 1,041 | 946 | 805 | 864 | 837 | 1,026 | 1,143 | 1,153 | 1,210 |
| 2018 | 1,083 | 1,063 | 1,095 | 1,201 | 1,260 | 1,137 | 1,215 | 1,201 | 1,128 | 1,124 | 1,271 | 1,312 |
| 2019 | 1,221 | 1,072 | 1,196 | 1,393 | 1,275 | 1,330 | 1,283 | 1,282 | 1,310 | 1,514 | 1,405 | 1,479 |
| 2020 | 1,565 | 1,480 | 1,460 | 1,454 | 1,223 | 1,346 | 1,404 | 1,386 | 1,326 | 1,724 | 1,654 | 1,758 |
| 2021 | 1,719 | 1,326 | 1,641 | 1,792 | 1,748 | 1,715 | 1,603 | 1,793 | 1,609 | 1,686 | 1,993 | 1,861 |
| 2022 | 1,783 | 1,723 | 1,847 | 1,774 | 1,884 | 1,995 | 1,730 | 1,886 | 1,783 | 1,984 | 1,861 | 2,040 |
| 2023 | 2,080 | 2,161 | 2,286 | 2,067 | 1,904 | 1,936 | 2,036 | 1,965 | 2,182 | 2,263 | 2,379 | 2,238 |
| 2024 | 2,248 | 2,404 | 2,230 | 2,249 | ||||||||
| - = No Data Reported; -- = Not Applicable; NA = Not Available; W = Withheld to avoid disclosure of individual company data. |
| Release Date: 6/28/2024 |
| Next Release Date: 7/31/2024 |