|
Download Data (XLS File) |
|
||||||||
|
||||||||
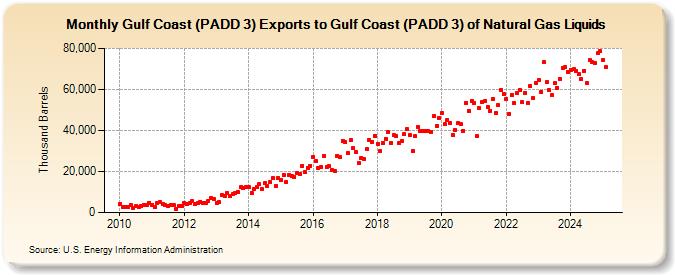
| Gulf Coast (PADD 3) Exports to Gulf Coast (PADD 3) of Natural Gas Liquids (Thousand Barrels) | ||||||||
| Year | Jan | Feb | Mar | Apr | May | Jun | Jul | Aug | Sep | Oct | Nov | Dec |
|---|---|---|---|---|---|---|---|---|---|---|---|---|
| 2010 | 4,012 | 2,505 | 2,881 | 2,594 | 3,584 | 2,433 | 3,207 | 2,764 | 3,272 | 3,882 | 3,604 | 4,756 |
| 2011 | 3,822 | 2,689 | 4,802 | 5,091 | 4,344 | 3,563 | 3,015 | 3,566 | 3,791 | 1,512 | 3,288 | 3,341 |
| 2012 | 4,663 | 4,000 | 4,594 | 5,614 | 4,312 | 4,538 | 5,290 | 4,792 | 4,446 | 5,655 | 7,137 | 6,652 |
| 2013 | 4,826 | 5,083 | 8,695 | 8,116 | 9,436 | 7,914 | 8,877 | 9,430 | 9,970 | 12,330 | 11,936 | 12,372 |
| 2014 | 12,242 | 9,763 | 11,402 | 12,392 | 13,765 | 11,322 | 14,237 | 12,834 | 14,758 | 16,755 | 13,040 | 16,828 |
| 2015 | 15,744 | 18,354 | 14,925 | 18,480 | 18,041 | 17,391 | 19,216 | 18,885 | 22,916 | 19,607 | 21,957 | 22,900 |
| 2016 | 27,216 | 25,043 | 21,956 | 22,320 | 27,411 | 22,005 | 22,471 | 20,841 | 20,477 | 27,735 | 26,963 | 35,064 |
| 2017 | 34,250 | 28,829 | 35,132 | 31,224 | 29,341 | 24,149 | 26,788 | 25,962 | 30,766 | 35,437 | 34,596 | 37,525 |
| 2018 | 33,585 | 29,767 | 33,934 | 36,035 | 39,057 | 34,114 | 37,655 | 37,243 | 33,854 | 34,833 | 38,121 | 40,661 |
| 2019 | 37,839 | 30,006 | 37,080 | 41,797 | 39,519 | 39,905 | 39,765 | 39,757 | 39,305 | 46,926 | 42,137 | 45,856 |
| 2020 | 48,500 | 42,912 | 45,266 | 43,626 | 37,918 | 40,379 | 43,511 | 42,951 | 39,765 | 53,459 | 49,620 | 54,488 |
| 2021 | 53,297 | 37,128 | 50,856 | 53,772 | 54,201 | 51,447 | 49,684 | 55,581 | 48,274 | 52,258 | 59,793 | 57,681 |
| 2022 | 55,267 | 48,248 | 57,248 | 53,206 | 58,390 | 59,849 | 53,636 | 58,457 | 53,482 | 61,502 | 55,820 | 63,246 |
| 2023 | 64,484 | 60,498 | 70,862 | 62,003 | 59,026 | 58,074 | 63,106 | 60,903 | 65,455 | 70,159 | 71,367 | 69,372 |
| 2024 | 69,684 | 69,720 | 69,141 | 67,455 | ||||||||
| - = No Data Reported; -- = Not Applicable; NA = Not Available; W = Withheld to avoid disclosure of individual company data. |
| Release Date: 6/28/2024 |
| Next Release Date: 7/31/2024 |