|
Download Data (XLS File) |
|
||||||||
|
||||||||
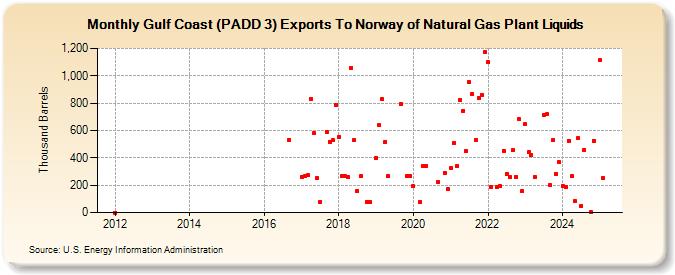
| Gulf Coast (PADD 3) Exports To Norway of Natural Gas Plant Liquids (Thousand Barrels) | ||||||||
| Year | Jan | Feb | Mar | Apr | May | Jun | Jul | Aug | Sep | Oct | Nov | Dec |
|---|---|---|---|---|---|---|---|---|---|---|---|---|
| 2012 | 0 | |||||||||||
| 2016 | 533 | |||||||||||
| 2017 | 262 | 266 | 271 | 832 | 578 | 249 | 80 | 590 | 518 | 528 | 789 | |
| 2018 | 552 | 264 | 264 | 261 | 1,058 | 527 | 158 | 265 | 76 | 76 | ||
| 2019 | 399 | 638 | 830 | 519 | 265 | 791 | 264 | 265 | ||||
| 2020 | 191 | 76 | 340 | 339 | 225 | 290 | 175 | |||||
| 2021 | 325 | 512 | 339 | 823 | 746 | 449 | 952 | 867 | 527 | 837 | 862 | 1,172 |
| 2022 | 1,098 | 189 | 190 | 191 | 451 | 281 | 263 | 457 | 263 | 681 | 155 | |
| 2023 | 645 | 440 | 421 | 263 | 713 | 717 | 199 | 527 | 282 | 368 | ||
| 2024 | 194 | 190 | 525 | 264 | 84 | 542 | ||||||
| - = No Data Reported; -- = Not Applicable; NA = Not Available; W = Withheld to avoid disclosure of individual company data. |
| Release Date: 8/30/2024 |
| Next Release Date: 9/30/2024 |