|
Download Data (XLS File) |
|
||||||||
|
||||||||
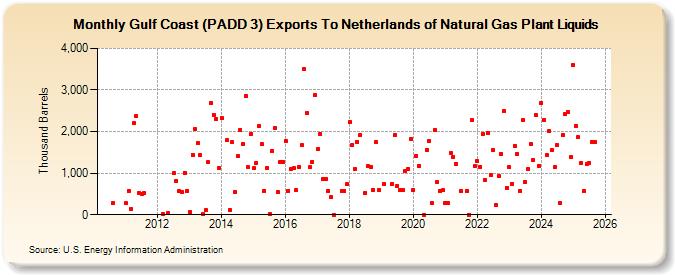
| Gulf Coast (PADD 3) Exports To Netherlands of Natural Gas Plant Liquids (Thousand Barrels) | ||||||||
| Year | Jan | Feb | Mar | Apr | May | Jun | Jul | Aug | Sep | Oct | Nov | Dec |
|---|---|---|---|---|---|---|---|---|---|---|---|---|
| 2010 | 273 | |||||||||||
| 2011 | 270 | 571 | 139 | 2,203 | 2,366 | 532 | 500 | 520 | ||||
| 2012 | 8 | 37 | 993 | 821 | 559 | 550 | 1,013 | 582 | ||||
| 2013 | 66 | 1,448 | 2,055 | 1,725 | 1,425 | 13 | 104 | 1,265 | 2,698 | 2,409 | 2,302 | 1,133 |
| 2014 | 2,324 | 1,788 | 108 | 1,742 | 552 | 1,402 | 2,047 | 1,701 | 2,862 | 1,145 | 1,937 | |
| 2015 | 1,116 | 1,248 | 2,125 | 1,706 | 577 | 1,133 | 12 | 1,530 | 2,086 | 550 | 1,278 | 1,273 |
| 2016 | 1,770 | 582 | 1,109 | 1,114 | 588 | 1,158 | 1,669 | 3,493 | 2,449 | 1,138 | 1,277 | 2,874 |
| 2017 | 1,575 | 1,945 | 855 | 856 | 575 | 419 | 5 | 578 | 569 | 727 | ||
| 2018 | 2,228 | 1,682 | 1,099 | 1,756 | 1,922 | 523 | 1,162 | 1,158 | 590 | 1,744 | 598 | |
| 2019 | 737 | 734 | 1,924 | 691 | 583 | 594 | 1,056 | 1,102 | 1,828 | |||
| 2020 | 597 | 1,414 | 1,175 | 0 | 1,551 | 1,778 | 270 | 2,037 | 780 | 572 | 584 | |
| 2021 | 274 | 273 | 1,484 | 1,394 | 1,231 | 570 | 569 | 0 | 2,267 | 1,162 | ||
| 2022 | 1,286 | 1,155 | 1,935 | 841 | 1,956 | 956 | 1,545 | 223 | 928 | 1,467 | 2,488 | 651 |
| 2023 | 1,782 | 747 | 1,658 | 1,465 | 582 | 2,271 | 793 | 1,096 | 1,962 | 1,014 | 2,387 | 1,151 |
| 2024 | 2,693 | 2,862 | 857 | 1,747 | ||||||||
| - = No Data Reported; -- = Not Applicable; NA = Not Available; W = Withheld to avoid disclosure of individual company data. |
| Release Date: 6/28/2024 |
| Next Release Date: 7/31/2024 |