|
Download Data (XLS File) |
|
||||||||
|
||||||||
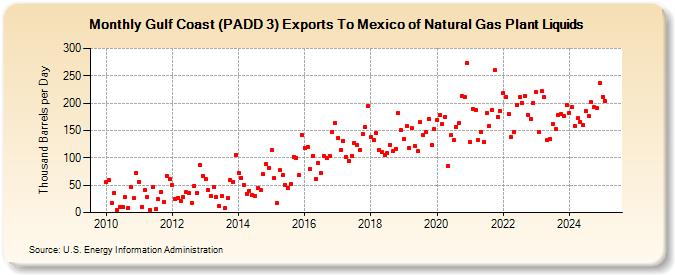
| Gulf Coast (PADD 3) Exports To Mexico of Natural Gas Plant Liquids (Thousand Barrels per Day) | ||||||||
| Year | Jan | Feb | Mar | Apr | May | Jun | Jul | Aug | Sep | Oct | Nov | Dec |
|---|---|---|---|---|---|---|---|---|---|---|---|---|
| 2010 | 55 | 59 | 18 | 36 | 5 | 10 | 10 | 28 | 9 | 47 | 26 | 73 |
| 2011 | 56 | 11 | 42 | 28 | 4 | 46 | 6 | 24 | 38 | 19 | 67 | 61 |
| 2012 | 50 | 25 | 27 | 21 | 28 | 37 | 36 | 18 | 49 | 36 | 87 | 67 |
| 2013 | 62 | 41 | 31 | 46 | 28 | 12 | 30 | 8 | 27 | 60 | 56 | 105 |
| 2014 | 72 | 64 | 51 | 34 | 40 | 33 | 31 | 45 | 42 | 70 | 89 | 82 |
| 2015 | 114 | 63 | 18 | 77 | 69 | 50 | 45 | 52 | 102 | 100 | 68 | 142 |
| 2016 | 118 | 120 | 80 | 104 | 62 | 91 | 72 | 103 | 99 | 104 | 148 | 163 |
| 2017 | 136 | 114 | 131 | 102 | 95 | 104 | 128 | 123 | 114 | 144 | 156 | 195 |
| 2018 | 138 | 132 | 145 | 114 | 110 | 105 | 108 | 124 | 112 | 116 | 182 | 150 |
| 2019 | 135 | 159 | 118 | 154 | 121 | 112 | 165 | 141 | 147 | 171 | 123 | 153 |
| 2020 | 169 | 178 | 161 | 174 | 85 | 141 | 132 | 157 | 164 | 213 | 211 | 273 |
| 2021 | 129 | 190 | 188 | 132 | 148 | 129 | 182 | 158 | 188 | 260 | 175 | 185 |
| 2022 | 218 | 211 | 181 | 138 | 148 | 197 | 211 | 201 | 213 | 179 | 171 | 200 |
| 2023 | 211 | 153 | 234 | 188 | 132 | 134 | 163 | 152 | 179 | 180 | 176 | 196 |
| 2024 | 182 | |||||||||||
| - = No Data Reported; -- = Not Applicable; NA = Not Available; W = Withheld to avoid disclosure of individual company data. |
| Release Date: 3/29/2024 |
| Next Release Date: 4/30/2024 |