|
Download Data (XLS File) |
|
||||||||
|
||||||||
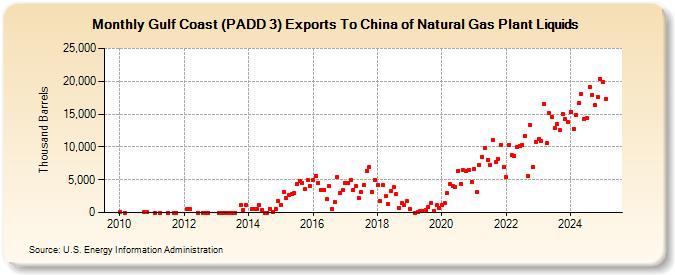
| Gulf Coast (PADD 3) Exports To China of Natural Gas Plant Liquids (Thousand Barrels) | ||||||||
| Year | Jan | Feb | Mar | Apr | May | Jun | Jul | Aug | Sep | Oct | Nov | Dec |
|---|---|---|---|---|---|---|---|---|---|---|---|---|
| 2010 | 58 | 1 | 29 | 41 | ||||||||
| 2011 | 3 | 2 | 6 | 4 | 2 | |||||||
| 2012 | 550 | 550 | 0 | 0 | 0 | 0 | ||||||
| 2013 | 0 | 0 | 3 | 0 | 0 | 0 | 0 | 1,105 | 389 | 1,154 | ||
| 2014 | 580 | 577 | 575 | 1,159 | 411 | 0 | 1 | 578 | 53 | 577 | 1,711 | |
| 2015 | 1,091 | 3,165 | 2,167 | 2,728 | 2,814 | 2,972 | 4,308 | 4,855 | 4,507 | 3,513 | 4,903 | 4,027 |
| 2016 | 4,997 | 5,614 | 4,547 | 3,476 | 3,393 | 2,029 | 3,987 | 576 | 1,623 | 5,471 | 2,968 | 3,468 |
| 2017 | 4,522 | 4,426 | 5,016 | 3,498 | 4,009 | 2,250 | 3,103 | 4,252 | 6,395 | 6,972 | 3,153 | 5,033 |
| 2018 | 4,137 | 1,731 | 4,195 | 2,452 | 1,339 | 3,282 | 3,824 | 2,779 | 764 | 1,413 | 1,130 | 1,704 |
| 2019 | 558 | 0 | 152 | 263 | 262 | 344 | 840 | 1,493 | 265 | 1,109 | 709 | |
| 2020 | 1,143 | 1,383 | 2,920 | 4,318 | 4,037 | 3,881 | 6,399 | 4,353 | 6,428 | 6,340 | 6,551 | 4,721 |
| 2021 | 6,668 | 3,093 | 7,174 | 8,500 | 9,886 | 8,048 | 7,308 | 11,072 | 7,644 | 8,202 | 10,329 | 6,934 |
| 2022 | 5,352 | 10,364 | 8,747 | 8,681 | 9,911 | 10,163 | 10,294 | 11,688 | 5,571 | 13,363 | 6,978 | 10,794 |
| 2023 | 11,457 | 10,284 | 15,423 | 10,538 | 15,087 | 15,659 | 12,539 | 12,576 | 12,232 | 15,011 | 14,238 | 12,651 |
| 2024 | 15,389 | |||||||||||
| - = No Data Reported; -- = Not Applicable; NA = Not Available; W = Withheld to avoid disclosure of individual company data. |
| Release Date: 3/29/2024 |
| Next Release Date: 4/30/2024 |