|
Download Data (XLS File) |
|
||||||||
|
||||||||
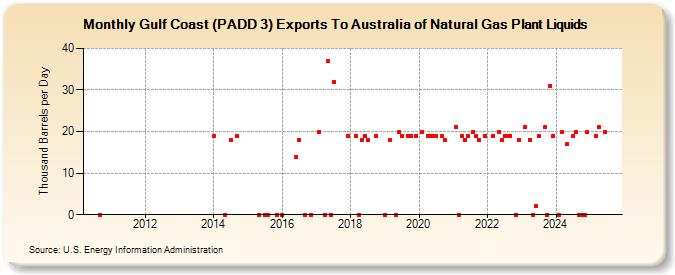
| Gulf Coast (PADD 3) Exports To Australia of Natural Gas Plant Liquids (Thousand Barrels per Day) | ||||||||
| Year | Jan | Feb | Mar | Apr | May | Jun | Jul | Aug | Sep | Oct | Nov | Dec |
|---|---|---|---|---|---|---|---|---|---|---|---|---|
| 2010 | 0 | |||||||||||
| 2014 | 19 | 0 | 18 | 19 | ||||||||
| 2015 | 0 | 0 | 0 | 0 | ||||||||
| 2016 | 0 | 14 | 18 | 0 | 0 | |||||||
| 2017 | 20 | 0 | 37 | 0 | 32 | 19 | ||||||
| 2018 | 19 | 0 | 18 | 19 | 18 | 19 | ||||||
| 2019 | 0 | 18 | 0 | 20 | 19 | 19 | 19 | 19 | ||||
| 2020 | 20 | 19 | 19 | 19 | 19 | 19 | 18 | |||||
| 2021 | 21 | 0 | 19 | 18 | 19 | 20 | 19 | 18 | 19 | |||
| 2022 | 19 | 20 | 18 | 19 | 19 | 19 | 0 | 18 | ||||
| 2023 | 20 | 18 | 19 | 2 | 19 | 21 | 0 | 46 | 19 | |||
| - = No Data Reported; -- = Not Applicable; NA = Not Available; W = Withheld to avoid disclosure of individual company data. |
| Release Date: 3/29/2024 |
| Next Release Date: 4/30/2024 |