|
Download Data (XLS File) |
|
||||||||
|
||||||||
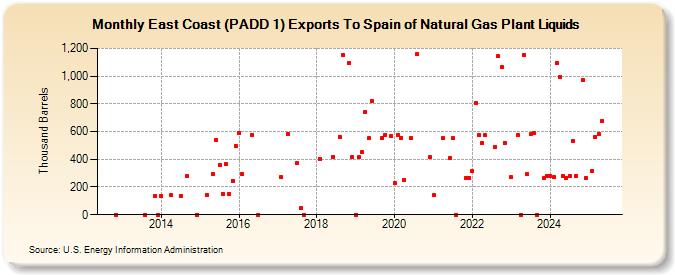
| East Coast (PADD 1) Exports To Spain of Natural Gas Plant Liquids (Thousand Barrels) | ||||||||
| Year | Jan | Feb | Mar | Apr | May | Jun | Jul | Aug | Sep | Oct | Nov | Dec |
|---|---|---|---|---|---|---|---|---|---|---|---|---|
| 2012 | 0 | |||||||||||
| 2013 | 0 | 136 | 0 | |||||||||
| 2014 | 136 | 142 | 134 | 279 | 0 | |||||||
| 2015 | 140 | 294 | 540 | 358 | 153 | 365 | 153 | 246 | 499 | |||
| 2016 | 592 | 292 | 575 | 0 | ||||||||
| 2017 | 269 | 584 | 370 | 46 | 0 | |||||||
| 2018 | 403 | 416 | 563 | 1,155 | 1,097 | 414 | ||||||
| 2019 | 0 | 414 | 454 | 743 | 550 | 821 | 552 | 575 | 569 | |||
| 2020 | 228 | 577 | 556 | 250 | 550 | 1,158 | 414 | |||||
| 2021 | 141 | 550 | 412 | 550 | 0 | 268 | 267 | |||||
| 2022 | 312 | 803 | 574 | 519 | 573 | 491 | 1,142 | 1,065 | 521 | |||
| 2023 | 269 | 0 | 1,152 | 292 | 580 | 587 | 0 | 264 | 281 | |||
| 2024 | 280 | |||||||||||
| - = No Data Reported; -- = Not Applicable; NA = Not Available; W = Withheld to avoid disclosure of individual company data. |
| Release Date: 3/29/2024 |
| Next Release Date: 4/30/2024 |