|
Download Data (XLS File) |
|
||||||||
|
||||||||
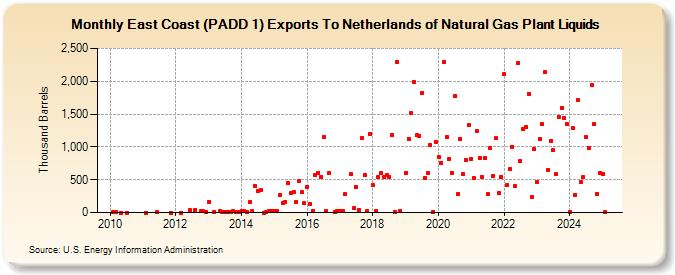
| East Coast (PADD 1) Exports To Netherlands of Natural Gas Plant Liquids (Thousand Barrels) | ||||||||
| Year | Jan | Feb | Mar | Apr | May | Jun | Jul | Aug | Sep | Oct | Nov | Dec |
|---|---|---|---|---|---|---|---|---|---|---|---|---|
| 2010 | 1 | 1 | 0 | 0 | ||||||||
| 2011 | 0 | 1 | 0 | |||||||||
| 2012 | 0 | 37 | 45 | 19 | 17 | 9 | ||||||
| 2013 | 163 | 15 | 21 | 15 | 14 | 15 | 11 | 17 | 15 | 13 | ||
| 2014 | 31 | 17 | 14 | 157 | 17 | 406 | 333 | 343 | 0 | 16 | 19 | 30 |
| 2015 | 24 | 25 | 263 | 142 | 165 | 452 | 301 | 317 | 155 | 473 | 306 | 145 |
| 2016 | 395 | 133 | 19 | 571 | 608 | 546 | 1,147 | 23 | 596 | 16 | 22 | |
| 2017 | 26 | 18 | 276 | 584 | 65 | 390 | 41 | 1,140 | 566 | 18 | 1,201 | |
| 2018 | 413 | 23 | 543 | 596 | 542 | 567 | 549 | 1,179 | 13 | 2,294 | 25 | |
| 2019 | 606 | 1,124 | 1,518 | 1,994 | 1,175 | 1,168 | 1,818 | 532 | 596 | 1,022 | 10 | 1,071 |
| 2020 | 846 | 761 | 2,292 | 1,149 | 815 | 608 | 1,772 | 279 | 1,124 | 586 | 804 | 1,337 |
| 2021 | 817 | 520 | 1,248 | 838 | 546 | 826 | 279 | 980 | 560 | 1,132 | 292 | 541 |
| 2022 | 2,108 | 418 | 657 | 1,005 | 400 | 2,274 | 782 | 1,276 | 1,302 | 1,808 | 231 | 961 |
| 2023 | 468 | 1,123 | 1,348 | 2,499 | 390 | 1,090 | 1,327 | 580 | 1,452 | 1,593 | 1,438 | 1,343 |
| 2024 | 12 | |||||||||||
| - = No Data Reported; -- = Not Applicable; NA = Not Available; W = Withheld to avoid disclosure of individual company data. |
| Release Date: 3/29/2024 |
| Next Release Date: 4/30/2024 |