|
Download Data (XLS File) |
|
||||||||
|
||||||||
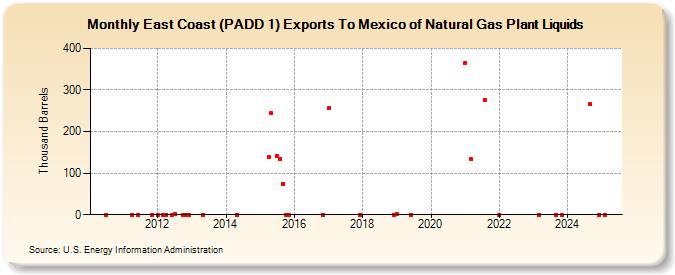
| East Coast (PADD 1) Exports To Mexico of Natural Gas Plant Liquids (Thousand Barrels) | ||||||||
| Year | Jan | Feb | Mar | Apr | May | Jun | Jul | Aug | Sep | Oct | Nov | Dec |
|---|---|---|---|---|---|---|---|---|---|---|---|---|
| 2010 | 0 | |||||||||||
| 2011 | 0 | 0 | 0 | |||||||||
| 2012 | 0 | 0 | 0 | 0 | 1 | 0 | 0 | 0 | ||||
| 2013 | 0 | |||||||||||
| 2014 | 0 | |||||||||||
| 2015 | 138 | 244 | 142 | 135 | 74 | 0 | 0 | |||||
| 2016 | 0 | |||||||||||
| 2017 | 256 | 0 | ||||||||||
| 2018 | 0 | |||||||||||
| 2019 | 1 | 0 | ||||||||||
| 2021 | 366 | 134 | 275 | |||||||||
| 2022 | 0 | |||||||||||
| 2023 | 552 | 0 | 0 | |||||||||
| - = No Data Reported; -- = Not Applicable; NA = Not Available; W = Withheld to avoid disclosure of individual company data. |
| Release Date: 6/28/2024 |
| Next Release Date: 7/31/2024 |