|
Download Data (XLS File) |
|
||||||||
|
||||||||
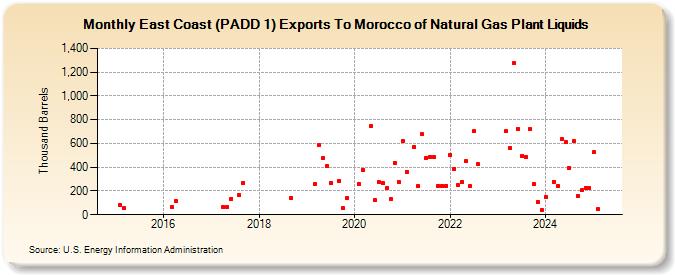
| East Coast (PADD 1) Exports To Morocco of Natural Gas Plant Liquids (Thousand Barrels) | ||||||||
| Year | Jan | Feb | Mar | Apr | May | Jun | Jul | Aug | Sep | Oct | Nov | Dec |
|---|---|---|---|---|---|---|---|---|---|---|---|---|
| 2015 | 80 | 53 | ||||||||||
| 2016 | 65 | 117 | ||||||||||
| 2017 | 66 | 65 | 136 | 162 | 270 | |||||||
| 2018 | 139 | |||||||||||
| 2019 | 257 | 586 | 475 | 409 | 267 | 284 | 56 | 138 | ||||
| 2020 | 260 | 378 | 743 | 123 | 276 | 265 | 226 | 131 | 439 | 275 | ||
| 2021 | 617 | 362 | 570 | 240 | 676 | 478 | 488 | 484 | 244 | 244 | 244 | |
| 2022 | 505 | 385 | 246 | 277 | 449 | 239 | 702 | 424 | ||||
| 2023 | 430 | 902 | 1,008 | 725 | 494 | 488 | 720 | 260 | 110 | 43 | ||
| 2024 | 151 | 279 | 241 | |||||||||
| - = No Data Reported; -- = Not Applicable; NA = Not Available; W = Withheld to avoid disclosure of individual company data. |
| Release Date: 6/28/2024 |
| Next Release Date: 7/31/2024 |