|
Download Data (XLS File) |
|
||||||||
|
||||||||
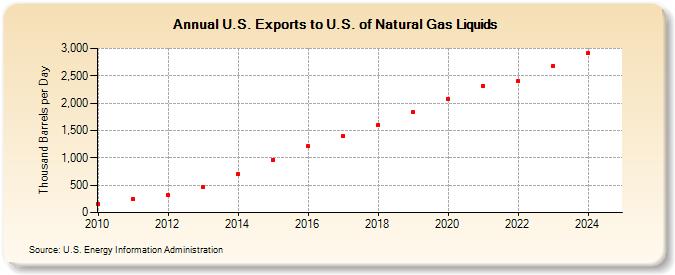
| U.S. Exports to U.S. of Natural Gas Liquids (Thousand Barrels per Day) | ||||||||
| Decade | Year-0 | Year-1 | Year-2 | Year-3 | Year-4 | Year-5 | Year-6 | Year-7 | Year-8 | Year-9 |
|---|---|---|---|---|---|---|---|---|---|---|
| 2010's | 164 | 249 | 314 | 468 | 703 | 966 | 1,211 | 1,404 | 1,602 | 1,830 |
| 2020's | 2,081 | 2,309 | 2,409 | 2,632 |
| - = No Data Reported; -- = Not Applicable; NA = Not Available; W = Withheld to avoid disclosure of individual company data. |
| Release Date: 3/29/2024 |
| Next Release Date: 8/30/2024 |