|
Download Data (XLS File) |
|
||||||||
|
||||||||
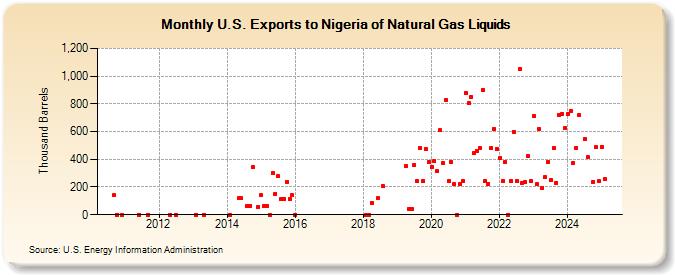
| U.S. Exports to Nigeria of Natural Gas Liquids (Thousand Barrels) | ||||||||
| Year | Jan | Feb | Mar | Apr | May | Jun | Jul | Aug | Sep | Oct | Nov | Dec |
|---|---|---|---|---|---|---|---|---|---|---|---|---|
| 2010 | 140 | 0 | 0 | |||||||||
| 2011 | 0 | 0 | ||||||||||
| 2012 | 0 | 0 | ||||||||||
| 2013 | 1 | 0 | ||||||||||
| 2014 | 1 | 117 | 118 | 64 | 64 | 341 | 59 | |||||
| 2015 | 139 | 64 | 64 | 0 | 300 | 153 | 278 | 114 | 114 | 239 | 113 | 141 |
| 2016 | 0 | |||||||||||
| 2018 | 0 | 0 | 87 | 118 | 205 | |||||||
| 2019 | 351 | 43 | 43 | 357 | 240 | 480 | 240 | 471 | 382 | |||
| 2020 | 345 | 385 | 313 | 609 | 375 | 830 | 240 | 379 | 221 | 0 | 221 | 241 |
| 2021 | 880 | 803 | 850 | 447 | 462 | 478 | 903 | 242 | 223 | 480 | 619 | 476 |
| 2022 | 409 | 242 | 380 | 0 | 241 | 599 | 242 | 1,048 | 228 | 239 | 423 | 240 |
| 2023 | 709 | 218 | 612 | 195 | 270 | 379 | 583 | 241 | 230 | 722 | 730 | 626 |
| 2024 | 726 | |||||||||||
| - = No Data Reported; -- = Not Applicable; NA = Not Available; W = Withheld to avoid disclosure of individual company data. |
| Release Date: 3/29/2024 |
| Next Release Date: 4/30/2024 |