|
Download Data (XLS File) |
|
||||||||
|
||||||||
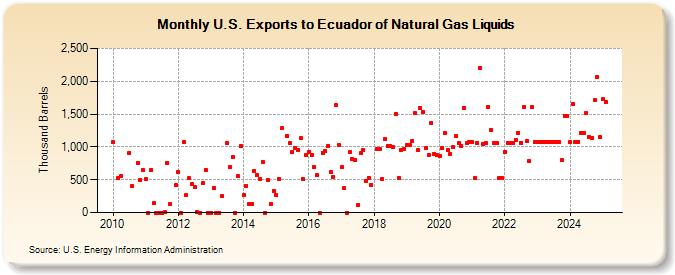
| U.S. Exports to Ecuador of Natural Gas Liquids (Thousand Barrels) | ||||||||
| Year | Jan | Feb | Mar | Apr | May | Jun | Jul | Aug | Sep | Oct | Nov | Dec |
|---|---|---|---|---|---|---|---|---|---|---|---|---|
| 2010 | 1,070 | 520 | 550 | 910 | 400 | 759 | 500 | 651 | ||||
| 2011 | 508 | 0 | 650 | 141 | 0 | 0 | 0 | 1 | 756 | 124 | 415 | |
| 2012 | 625 | 0 | 1,075 | 261 | 525 | 429 | 395 | 1 | 0 | 446 | 652 | 0 |
| 2013 | 0 | 373 | 0 | 0 | 249 | 1,055 | 701 | 845 | 0 | 550 | 1,013 | |
| 2014 | 263 | 404 | 127 | 124 | 636 | 572 | 509 | 776 | 0 | 503 | 130 | 325 |
| 2015 | 265 | 513 | 1,283 | 1,168 | 1,058 | 917 | 987 | 957 | 1,129 | 506 | 873 | |
| 2016 | 926 | 877 | 692 | 574 | 0 | 912 | 934 | 1,018 | 619 | 548 | 1,631 | 1,027 |
| 2017 | 696 | 367 | 0 | 921 | 818 | 805 | 114 | 902 | 951 | 484 | 525 | 424 |
| 2018 | 968 | 974 | 506 | 1,115 | 1,013 | 1,011 | 998 | 1,501 | 530 | 959 | 971 | |
| 2019 | 1,032 | 1,027 | 1,093 | 1,513 | 952 | 1,596 | 1,538 | 985 | 877 | 1,367 | 896 | 870 |
| 2020 | 865 | 986 | 1,208 | 952 | 889 | 1,001 | 1,164 | 1,062 | 1,014 | 1,593 | 1,058 | 1,071 |
| 2021 | 1,067 | 531 | 1,061 | 2,208 | 1,043 | 1,059 | 1,604 | 1,263 | 1,063 | 1,059 | 532 | 524 |
| 2022 | 922 | 1,063 | 1,062 | 1,065 | 1,111 | 1,217 | 1,066 | 1,612 | 1,088 | 784 | 1,605 | 1,074 |
| 2023 | 1,034 | 1,071 | 1,078 | 1,074 | 1,071 | 1,072 | 1,068 | 1,074 | 1,072 | 797 | 1,473 | 1,478 |
| 2024 | 1,068 | |||||||||||
| - = No Data Reported; -- = Not Applicable; NA = Not Available; W = Withheld to avoid disclosure of individual company data. |
| Release Date: 3/29/2024 |
| Next Release Date: 4/30/2024 |