|
Download Data (XLS File) |
|
||||||||
|
||||||||
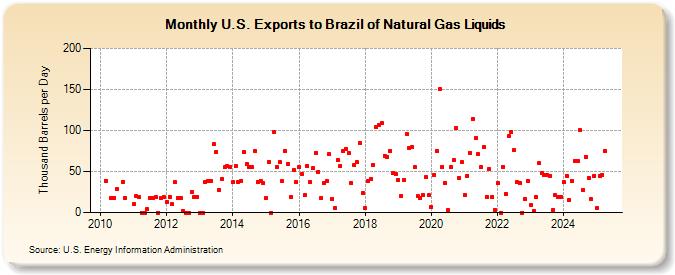
| U.S. Exports to Brazil of Natural Gas Liquids (Thousand Barrels per Day) | ||||||||
| Year | Jan | Feb | Mar | Apr | May | Jun | Jul | Aug | Sep | Oct | Nov | Dec |
|---|---|---|---|---|---|---|---|---|---|---|---|---|
| 2010 | 39 | 18 | 18 | 29 | 37 | 18 | ||||||
| 2011 | 10 | 20 | 19 | 0 | 0 | 4 | 18 | 18 | 19 | 0 | 18 | 19 |
| 2012 | 13 | 19 | 10 | 37 | 18 | 18 | 2 | 0 | 0 | 25 | 19 | 19 |
| 2013 | 0 | 0 | 37 | 39 | 39 | 83 | 74 | 28 | 41 | 55 | 57 | 56 |
| 2014 | 37 | 57 | 37 | 39 | 74 | 59 | 55 | 55 | 75 | 37 | 39 | 36 |
| 2015 | 18 | 62 | 0 | 98 | 56 | 61 | 38 | 75 | 59 | 19 | 52 | 37 |
| 2016 | 55 | 47 | 21 | 57 | 37 | 54 | 73 | 50 | 18 | 36 | 38 | 71 |
| 2017 | 17 | 6 | 64 | 57 | 75 | 78 | 73 | 36 | 58 | 61 | 85 | 24 |
| 2018 | 5 | 39 | 41 | 58 | 104 | 107 | 109 | 69 | 68 | 75 | 48 | 47 |
| 2019 | 40 | 20 | 40 | 96 | 79 | 80 | 55 | 20 | 18 | 21 | 43 | 21 |
| 2020 | 7 | 46 | 75 | 150 | 56 | 36 | 3 | 55 | 64 | 103 | 42 | 61 |
| 2021 | 21 | 45 | 73 | 114 | 91 | 71 | 55 | 80 | 19 | 53 | 19 | 3 |
| 2022 | 36 | 0 | 56 | 23 | 93 | 98 | 76 | 37 | 36 | 0 | 17 | 39 |
| 2023 | 9 | 2 | 19 | 60 | 48 | 46 | 48 | 45 | 3 | 21 | 19 | 19 |
| 2024 | 37 | 45 | 15 | 39 | ||||||||
| - = No Data Reported; -- = Not Applicable; NA = Not Available; W = Withheld to avoid disclosure of individual company data. |
| Release Date: 6/28/2024 |
| Next Release Date: 7/31/2024 |