|
Download Data (XLS File) |
|
||||||||
|
||||||||
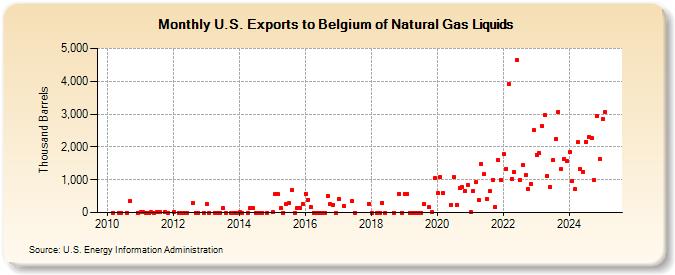
| U.S. Exports to Belgium of Natural Gas Liquids (Thousand Barrels) | ||||||||
| Year | Jan | Feb | Mar | Apr | May | Jun | Jul | Aug | Sep | Oct | Nov | Dec |
|---|---|---|---|---|---|---|---|---|---|---|---|---|
| 2010 | 1 | 0 | 0 | 1 | 350 | 0 | ||||||
| 2011 | 4 | 2 | 1 | 0 | 2 | 0 | 2 | 3 | 2 | 0 | ||
| 2012 | 2 | 0 | 1 | 1 | 1 | 303 | 0 | 0 | 0 | |||
| 2013 | 256 | 0 | 1 | 0 | 0 | 133 | 0 | 0 | 0 | 1 | ||
| 2014 | 2 | 1 | 1 | 138 | 135 | 0 | 0 | 0 | 1 | |||
| 2015 | 3 | 574 | 554 | 136 | 1 | 252 | 277 | 697 | 1 | 146 | 147 | 259 |
| 2016 | 580 | 393 | 155 | 0 | 0 | 1 | 1 | 1 | 500 | 252 | 242 | 1 |
| 2017 | 414 | 201 | 340 | 0 | 271 | |||||||
| 2018 | 0 | 0 | 0 | 301 | 1 | 0 | 577 | 0 | ||||
| 2019 | 575 | 569 | 0 | 0 | 0 | 1 | 0 | 249 | 164 | 2 | 1,042 | |
| 2020 | 588 | 1,087 | 582 | 242 | 1,087 | 240 | 750 | 777 | 645 | 849 | ||
| 2021 | 15 | 658 | 916 | 395 | 1,473 | 1,164 | 422 | 646 | 1,003 | 175 | 1,601 | 992 |
| 2022 | 1,779 | 1,335 | 3,907 | 1,031 | 1,234 | 4,646 | 998 | 1,446 | 1,148 | 704 | 879 | 2,519 |
| 2023 | 2,323 | 1,699 | 2,270 | 2,771 | 1,121 | 785 | 1,591 | 1,666 | 2,794 | 1,313 | 1,664 | 1,662 |
| 2024 | 1,841 | |||||||||||
| - = No Data Reported; -- = Not Applicable; NA = Not Available; W = Withheld to avoid disclosure of individual company data. |
| Release Date: 3/29/2024 |
| Next Release Date: 4/30/2024 |