|
Download Data (XLS File) |
|
||||||||
|
||||||||
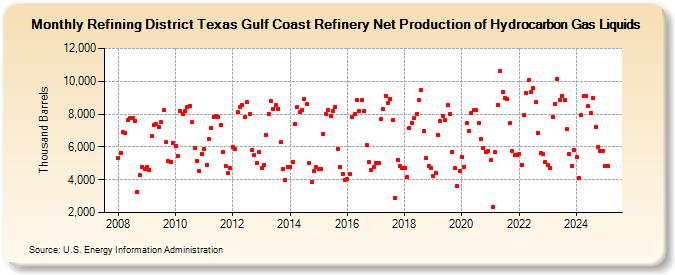
| Refining District Texas Gulf Coast Refinery Net Production of Hydrocarbon Gas Liquids (Thousand Barrels) | ||||||||
| Year | Jan | Feb | Mar | Apr | May | Jun | Jul | Aug | Sep | Oct | Nov | Dec |
|---|---|---|---|---|---|---|---|---|---|---|---|---|
| 2008 | 5,352 | 5,631 | 6,908 | 6,823 | 7,615 | 7,759 | 7,735 | 7,604 | 3,262 | 4,284 | 4,767 | 4,678 |
| 2009 | 4,799 | 4,620 | 6,677 | 7,319 | 7,400 | 7,219 | 7,500 | 8,232 | 6,270 | 5,144 | 5,067 | 6,265 |
| 2010 | 6,048 | 5,470 | 8,188 | 8,034 | 8,198 | 8,436 | 8,480 | 7,490 | 5,953 | 5,147 | 4,551 | 5,592 |
| 2011 | 5,882 | 4,912 | 6,460 | 7,179 | 7,807 | 7,862 | 7,821 | 7,332 | 5,663 | 4,834 | 4,390 | 4,706 |
| 2012 | 5,992 | 5,854 | 8,118 | 8,403 | 8,561 | 7,796 | 8,711 | 7,993 | 5,809 | 5,507 | 5,037 | 5,681 |
| 2013 | 4,704 | 4,885 | 6,719 | 8,004 | 8,773 | 8,328 | 8,543 | 8,338 | 6,277 | 4,683 | 4,013 | 4,781 |
| 2014 | 4,788 | 5,079 | 7,423 | 8,401 | 8,127 | 8,250 | 8,911 | 8,629 | 5,010 | 3,873 | 4,513 | 4,760 |
| 2015 | 4,642 | 4,664 | 6,813 | 8,002 | 8,268 | 7,884 | 8,199 | 8,452 | 5,888 | 4,778 | 4,350 | 3,968 |
| 2016 | 4,014 | 4,323 | 7,808 | 8,001 | 8,868 | 8,197 | 8,841 | 8,193 | 6,123 | 5,057 | 4,597 | 4,760 |
| 2017 | 5,012 | 5,047 | 7,693 | 8,306 | 9,124 | 8,649 | 8,933 | 7,662 | 2,894 | 5,232 | 4,842 | 4,699 |
| 2018 | 4,735 | 4,185 | 7,163 | 7,444 | 7,739 | 8,018 | 8,839 | 9,479 | 6,955 | 5,314 | 4,866 | 4,702 |
| 2019 | 4,241 | 4,430 | 6,754 | 7,547 | 7,888 | 7,609 | 8,573 | 7,981 | 5,706 | 4,684 | 3,603 | 4,507 |
| 2020 | 5,390 | 4,799 | 7,455 | 6,990 | 8,067 | 8,256 | 8,249 | 7,446 | 6,470 | 5,931 | 5,706 | 5,761 |
| 2021 | 5,201 | 2,326 | 5,668 | 8,554 | 10,651 | 9,373 | 8,980 | 8,917 | 7,445 | 5,758 | 5,476 | 5,481 |
| 2022 | 5,586 | 4,915 | 7,922 | 9,260 | 10,085 | 9,354 | 9,586 | 8,747 | 6,836 | 5,614 | 5,541 | 5,053 |
| 2023 | 4,922 | 4,742 | 7,823 | 8,586 | 10,125 | 8,881 | 9,116 | 8,847 | 7,084 | 5,578 | 4,848 | 5,816 |
| 2024 | 5,389 | |||||||||||
| - = No Data Reported; -- = Not Applicable; NA = Not Available; W = Withheld to avoid disclosure of individual company data. |
| Release Date: 3/29/2024 |
| Next Release Date: 4/30/2024 |