|
Download Data (XLS File) |
|
||||||||
|
||||||||
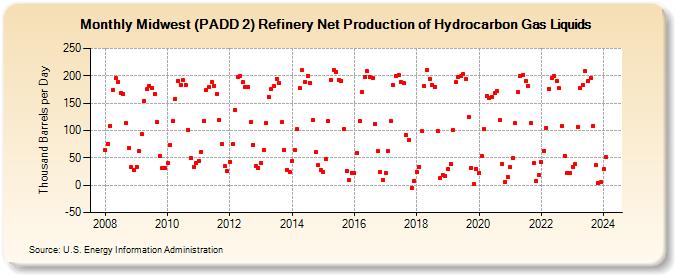
| Midwest (PADD 2) Refinery Net Production of Hydrocarbon Gas Liquids (Thousand Barrels per Day) | ||||||||
| Year | Jan | Feb | Mar | Apr | May | Jun | Jul | Aug | Sep | Oct | Nov | Dec |
|---|---|---|---|---|---|---|---|---|---|---|---|---|
| 2008 | 64 | 76 | 109 | 174 | 195 | 189 | 169 | 167 | 113 | 68 | 33 | 27 |
| 2009 | 34 | 62 | 93 | 154 | 175 | 182 | 177 | 166 | 115 | 53 | 31 | 31 |
| 2010 | 40 | 74 | 117 | 158 | 191 | 184 | 192 | 184 | 101 | 49 | 33 | 40 |
| 2011 | 45 | 61 | 118 | 174 | 179 | 189 | 182 | 167 | 120 | 76 | 35 | 26 |
| 2012 | 43 | 75 | 137 | 198 | 200 | 188 | 179 | 179 | 115 | 74 | 35 | 31 |
| 2013 | 41 | 65 | 114 | 161 | 175 | 181 | 194 | 186 | 115 | 64 | 28 | 25 |
| 2014 | 44 | 64 | 102 | 177 | 210 | 189 | 200 | 187 | 119 | 60 | 36 | 28 |
| 2015 | 25 | 47 | 117 | 193 | 211 | 207 | 193 | 190 | 103 | 26 | 9 | 23 |
| 2016 | 22 | 58 | 117 | 170 | 197 | 208 | 197 | 195 | 112 | 62 | 24 | 10 |
| 2017 | 22 | 62 | 118 | 183 | 199 | 201 | 188 | 186 | 91 | 82 | -6 | 8 |
| 2018 | 25 | 33 | 99 | 181 | 211 | 194 | 183 | 180 | 99 | 13 | 19 | 17 |
| 2019 | 29 | 39 | 100 | 188 | 197 | 199 | 204 | 194 | 125 | 32 | 2 | 30 |
| 2020 | 23 | 54 | 103 | 163 | 160 | 162 | 168 | 172 | 119 | 39 | 6 | 15 |
| 2021 | 33 | 49 | 113 | 170 | 200 | 202 | 190 | 181 | 114 | 41 | 8 | 18 |
| 2022 | 42 | 63 | 105 | 175 | 195 | 199 | 190 | 177 | 109 | 54 | 23 | 22 |
| 2023 | 34 | 38 | 107 | 177 | 184 | 208 | 190 | 196 | 109 | 36 | 4 | 5 |
| 2024 | 29 | 51 | ||||||||||
| - = No Data Reported; -- = Not Applicable; NA = Not Available; W = Withheld to avoid disclosure of individual company data. |
| Release Date: 4/30/2024 |
| Next Release Date: 5/31/2024 |