|
Download Data (XLS File) |
|
||||||||
|
||||||||
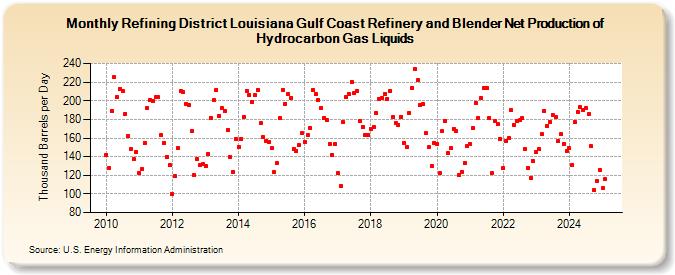
| Refining District Louisiana Gulf Coast Refinery and Blender Net Production of Hydrocarbon Gas Liquids (Thousand Barrels per Day) | ||||||||
| Year | Jan | Feb | Mar | Apr | May | Jun | Jul | Aug | Sep | Oct | Nov | Dec |
|---|---|---|---|---|---|---|---|---|---|---|---|---|
| 2010 | 142 | 128 | 189 | 225 | 204 | 213 | 211 | 186 | 162 | 148 | 137 | 145 |
| 2011 | 122 | 127 | 155 | 192 | 201 | 200 | 204 | 204 | 163 | 155 | 140 | 131 |
| 2012 | 100 | 119 | 149 | 211 | 209 | 197 | 195 | 167 | 120 | 137 | 131 | 132 |
| 2013 | 130 | 143 | 182 | 201 | 212 | 184 | 192 | 189 | 169 | 140 | 124 | 159 |
| 2014 | 150 | 159 | 183 | 211 | 206 | 199 | 206 | 212 | 176 | 161 | 157 | 156 |
| 2015 | 149 | 123 | 133 | 181 | 212 | 197 | 207 | 203 | 148 | 146 | 152 | 165 |
| 2016 | 156 | 163 | 171 | 212 | 207 | 201 | 192 | 182 | 179 | 154 | 142 | 154 |
| 2017 | 122 | 108 | 177 | 204 | 207 | 220 | 208 | 211 | 178 | 172 | 163 | 163 |
| 2018 | 170 | 172 | 187 | 202 | 203 | 207 | 202 | 211 | 183 | 176 | 174 | 183 |
| 2019 | 155 | 150 | 187 | 214 | 234 | 222 | 195 | 196 | 165 | 150 | 130 | 155 |
| 2020 | 154 | 122 | 167 | 178 | 144 | 149 | 170 | 167 | 120 | 124 | 133 | 151 |
| 2021 | 154 | 171 | 198 | 182 | 203 | 214 | 214 | 182 | 122 | 178 | 175 | 159 |
| 2022 | 128 | 157 | 160 | 190 | 174 | 178 | 179 | 181 | 148 | 128 | 117 | 135 |
| 2023 | 145 | 148 | 164 | 189 | 173 | 177 | 185 | 183 | 157 | 164 | 154 | 146 |
| 2024 | 149 | 131 | 177 | 188 | 193 | 190 | 192 | 186 | 151 | 104 | 114 | 126 |
| 2025 | 106 | 116 | 161 | 181 | ||||||||
| - = No Data Reported; -- = Not Applicable; NA = Not Available; W = Withheld to avoid disclosure of individual company data. |
| Release Date: 6/30/2025 |
| Next Release Date: 7/31/2025 |