|
Download Data (XLS File) |
|
||||||||
|
||||||||
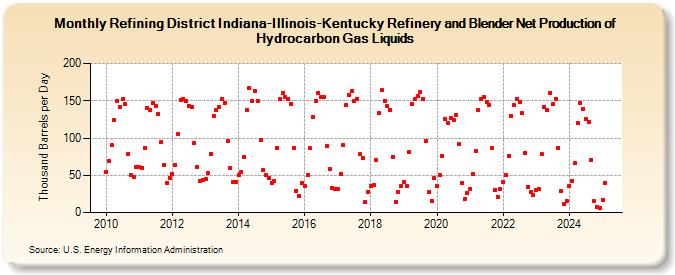
| Refining District Indiana-Illinois-Kentucky Refinery and Blender Net Production of Hydrocarbon Gas Liquids (Thousand Barrels per Day) | ||||||||
| Year | Jan | Feb | Mar | Apr | May | Jun | Jul | Aug | Sep | Oct | Nov | Dec |
|---|---|---|---|---|---|---|---|---|---|---|---|---|
| 2010 | 55 | 69 | 90 | 124 | 150 | 141 | 153 | 145 | 79 | 50 | 48 | 61 |
| 2011 | 61 | 60 | 87 | 140 | 138 | 147 | 143 | 132 | 94 | 64 | 40 | 47 |
| 2012 | 52 | 64 | 105 | 151 | 153 | 150 | 143 | 142 | 93 | 61 | 42 | 44 |
| 2013 | 45 | 53 | 79 | 130 | 137 | 141 | 153 | 147 | 96 | 60 | 41 | 41 |
| 2014 | 50 | 54 | 74 | 137 | 167 | 149 | 163 | 150 | 97 | 57 | 51 | 47 |
| 2015 | 39 | 43 | 87 | 152 | 161 | 155 | 152 | 146 | 87 | 29 | 22 | 40 |
| 2016 | 36 | 50 | 86 | 128 | 150 | 161 | 155 | 155 | 89 | 58 | 33 | 31 |
| 2017 | 31 | 52 | 90 | 144 | 158 | 163 | 150 | 153 | 78 | 73 | 14 | 28 |
| 2018 | 36 | 37 | 70 | 134 | 165 | 150 | 143 | 138 | 75 | 14 | 28 | 35 |
| 2019 | 41 | 36 | 81 | 146 | 152 | 156 | 162 | 153 | 96 | 27 | 16 | 46 |
| 2020 | 35 | 50 | 76 | 125 | 120 | 127 | 124 | 131 | 92 | 39 | 18 | 26 |
| 2021 | 32 | 52 | 83 | 138 | 153 | 155 | 148 | 144 | 86 | 30 | 21 | 32 |
| 2022 | 41 | 50 | 76 | 130 | 144 | 153 | 148 | 133 | 80 | 34 | 27 | 23 |
| 2023 | 30 | 31 | 78 | 142 | 137 | 161 | 145 | 153 | 87 | 29 | 11 | 16 |
| 2024 | 36 | |||||||||||
| - = No Data Reported; -- = Not Applicable; NA = Not Available; W = Withheld to avoid disclosure of individual company data. |
| Release Date: 3/29/2024 |
| Next Release Date: 4/30/2024 |