|
Download Data (XLS File) |
|
||||||||
|
||||||||
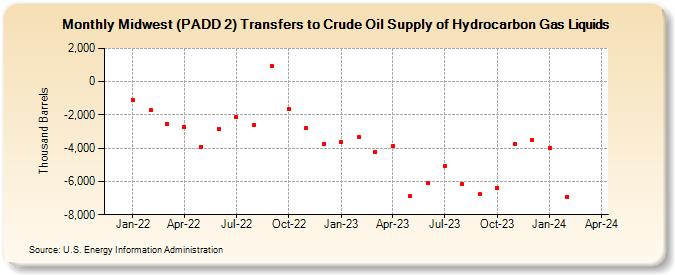
| Midwest (PADD 2) Transfers to Crude Oil Supply of Hydrocarbon Gas Liquids (Thousand Barrels) | ||||||||
| Year | Jan | Feb | Mar | Apr | May | Jun | Jul | Aug | Sep | Oct | Nov | Dec |
|---|---|---|---|---|---|---|---|---|---|---|---|---|
| 2022 | -1,074 | -1,730 | -2,535 | -2,729 | -3,914 | -2,871 | -2,136 | -2,618 | 959 | -1,668 | -2,797 | -3,726 |
| 2023 | -3,641 | -3,321 | -4,258 | -3,889 | -6,894 | -6,112 | -5,090 | -6,164 | -6,778 | -6,390 | -3,747 | -3,525 |
| 2024 | -3,960 | -6,929 | ||||||||||
| - = No Data Reported; -- = Not Applicable; NA = Not Available; W = Withheld to avoid disclosure of individual company data. |
| Release Date: 4/30/2024 |
| Next Release Date: 5/31/2024 |