|
Download Data (XLS File) |
|
||||||||
|
||||||||
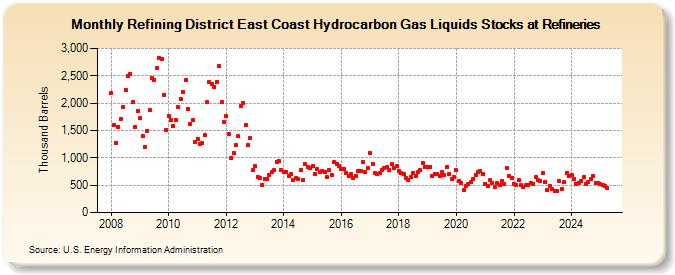
| Refining District East Coast Hydrocarbon Gas Liquids Stocks at Refineries (Thousand Barrels) | ||||||||
| Year | Jan | Feb | Mar | Apr | May | Jun | Jul | Aug | Sep | Oct | Nov | Dec |
|---|---|---|---|---|---|---|---|---|---|---|---|---|
| 2008 | 2,178 | 1,594 | 1,279 | 1,569 | 1,707 | 1,925 | 2,245 | 2,495 | 2,538 | 2,018 | 1,565 | 1,853 |
| 2009 | 1,720 | 1,403 | 1,193 | 1,495 | 1,879 | 2,462 | 2,431 | 2,638 | 2,831 | 2,814 | 2,145 | 1,510 |
| 2010 | 1,764 | 1,687 | 1,590 | 1,695 | 1,935 | 2,082 | 2,195 | 2,417 | 1,899 | 1,618 | 1,691 | 1,291 |
| 2011 | 1,352 | 1,244 | 1,270 | 1,421 | 2,013 | 2,378 | 2,352 | 2,303 | 2,385 | 2,670 | 2,020 | 1,656 |
| 2012 | 1,762 | 1,438 | 998 | 1,086 | 1,236 | 1,398 | 1,944 | 1,994 | 1,601 | 1,226 | 1,366 | 769 |
| 2013 | 843 | 656 | 635 | 505 | 611 | 617 | 690 | 737 | 771 | 933 | 943 | 769 |
| 2014 | 747 | 736 | 665 | 699 | 587 | 624 | 616 | 786 | 603 | 882 | 827 | 809 |
| 2015 | 843 | 710 | 794 | 733 | 761 | 736 | 650 | 770 | 684 | 916 | 885 | 853 |
| 2016 | 803 | 805 | 715 | 665 | 707 | 625 | 660 | 755 | 761 | 925 | 739 | 814 |
| 2017 | 1,089 | 895 | 716 | 711 | 725 | 784 | 807 | 826 | 773 | 888 | 814 | 845 |
| 2018 | 761 | 717 | 696 | 630 | 590 | 657 | 725 | 675 | 735 | 769 | 909 | 830 |
| 2019 | 838 | 828 | 667 | 697 | 708 | 664 | 742 | 683 | 839 | 701 | 609 | 643 |
| 2020 | 770 | 582 | 534 | 404 | 487 | 523 | 556 | 618 | 679 | 738 | 759 | 710 |
| 2021 | 531 | 479 | 590 | 548 | 469 | 535 | 505 | 570 | 514 | 821 | 659 | 636 |
| 2022 | 515 | 504 | 590 | 500 | 467 | 503 | 511 | 544 | 520 | 644 | 593 | 576 |
| 2023 | 717 | 561 | 409 | 490 | 429 | 389 | 385 | 576 | 439 | 557 | 716 | 667 |
| 2024 | 682 | |||||||||||
| - = No Data Reported; -- = Not Applicable; NA = Not Available; W = Withheld to avoid disclosure of individual company data. |
| Release Date: 3/29/2024 |
| Next Release Date: 4/30/2024 |
Referring Pages: