|
Download Data (XLS File) |
|
||||||||
|
||||||||
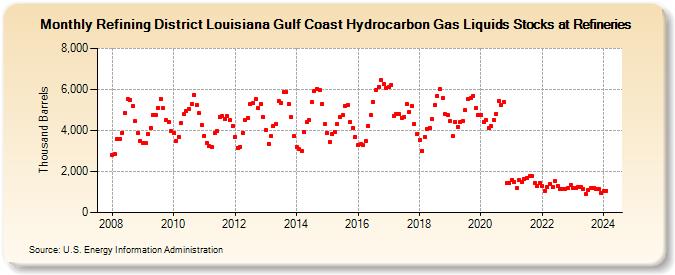
| Refining District Louisiana Gulf Coast Hydrocarbon Gas Liquids Stocks at Refineries (Thousand Barrels) | ||||||||
| Year | Jan | Feb | Mar | Apr | May | Jun | Jul | Aug | Sep | Oct | Nov | Dec |
|---|---|---|---|---|---|---|---|---|---|---|---|---|
| 2008 | 2,829 | 2,836 | 3,564 | 3,603 | 3,892 | 4,853 | 5,517 | 5,501 | 5,183 | 4,447 | 3,889 | 3,478 |
| 2009 | 3,372 | 3,388 | 3,832 | 4,138 | 4,755 | 4,749 | 5,118 | 5,557 | 5,076 | 4,509 | 4,420 | 3,966 |
| 2010 | 3,869 | 3,484 | 3,691 | 4,373 | 4,781 | 4,966 | 5,052 | 5,285 | 5,747 | 5,253 | 4,843 | 4,261 |
| 2011 | 3,734 | 3,393 | 3,228 | 3,195 | 3,860 | 3,980 | 4,660 | 4,693 | 4,553 | 4,685 | 4,499 | 4,207 |
| 2012 | 3,690 | 3,162 | 3,214 | 3,890 | 4,521 | 4,625 | 5,277 | 5,324 | 5,541 | 5,087 | 5,290 | 4,642 |
| 2013 | 4,006 | 3,361 | 3,748 | 4,217 | 4,332 | 5,420 | 5,354 | 5,864 | 5,877 | 5,281 | 4,642 | 3,734 |
| 2014 | 3,219 | 3,083 | 3,017 | 3,904 | 4,405 | 4,522 | 5,374 | 5,903 | 6,036 | 5,958 | 5,305 | 4,296 |
| 2015 | 3,871 | 3,453 | 3,816 | 3,936 | 4,315 | 4,641 | 4,765 | 5,217 | 5,230 | 4,407 | 4,129 | 3,694 |
| 2016 | 3,268 | 3,322 | 3,273 | 3,463 | 4,237 | 4,755 | 5,398 | 5,964 | 6,134 | 6,440 | 6,258 | 6,071 |
| 2017 | 6,135 | 6,227 | 4,726 | 4,807 | 4,803 | 4,625 | 4,676 | 5,284 | 4,915 | 5,191 | 4,325 | 3,851 |
| 2018 | 3,535 | 3,002 | 3,695 | 4,072 | 4,142 | 4,545 | 5,221 | 5,701 | 6,000 | 5,599 | 4,791 | 4,768 |
| 2019 | 4,449 | 3,723 | 4,430 | 4,188 | 4,417 | 4,453 | 4,981 | 5,526 | 5,564 | 5,699 | 5,105 | 4,744 |
| 2020 | 4,762 | 4,410 | 4,489 | 4,135 | 4,217 | 4,527 | 4,824 | 5,452 | 5,258 | 5,397 | 1,419 | 1,464 |
| 2021 | 1,587 | 1,491 | 1,202 | 1,586 | 1,504 | 1,653 | 1,707 | 1,767 | 1,773 | 1,461 | 1,303 | 1,453 |
| 2022 | 1,285 | 1,073 | 1,252 | 1,410 | 1,245 | 1,525 | 1,317 | 1,148 | 1,147 | 1,172 | 1,205 | 1,352 |
| 2023 | 1,192 | 1,185 | 1,262 | 1,230 | 1,157 | 903 | 1,094 | 1,180 | 1,213 | 1,154 | 1,141 | 974 |
| 2024 | 1,033 | |||||||||||
| - = No Data Reported; -- = Not Applicable; NA = Not Available; W = Withheld to avoid disclosure of individual company data. |
| Release Date: 3/29/2024 |
| Next Release Date: 4/30/2024 |