|
Download Data (XLS File) |
|
||||||||
|
||||||||
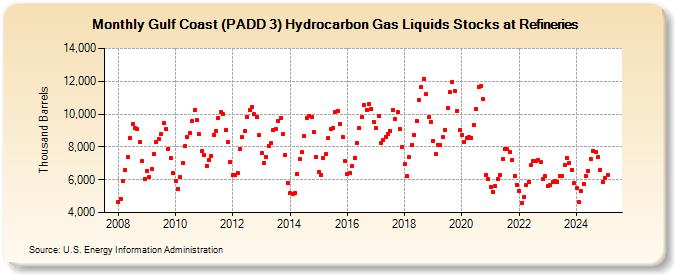
| Gulf Coast (PADD 3) Hydrocarbon Gas Liquids Stocks at Refineries (Thousand Barrels) | ||||||||
| Year | Jan | Feb | Mar | Apr | May | Jun | Jul | Aug | Sep | Oct | Nov | Dec |
|---|---|---|---|---|---|---|---|---|---|---|---|---|
| 2008 | 4,672 | 4,846 | 5,901 | 6,602 | 7,357 | 8,552 | 9,384 | 9,149 | 9,074 | 8,311 | 7,114 | 6,071 |
| 2009 | 6,518 | 6,169 | 6,673 | 7,576 | 8,280 | 8,462 | 8,802 | 9,478 | 9,091 | 7,888 | 7,302 | 6,383 |
| 2010 | 5,921 | 5,440 | 6,180 | 7,042 | 8,031 | 8,594 | 8,861 | 9,552 | 10,260 | 9,625 | 8,767 | 7,733 |
| 2011 | 7,486 | 6,866 | 7,214 | 7,468 | 8,747 | 8,995 | 9,775 | 10,095 | 9,986 | 9,037 | 8,326 | 7,110 |
| 2012 | 6,281 | 6,283 | 6,415 | 7,865 | 8,592 | 8,942 | 9,839 | 10,233 | 10,416 | 9,975 | 9,798 | 8,697 |
| 2013 | 7,601 | 7,021 | 7,383 | 8,060 | 8,237 | 9,015 | 9,086 | 9,582 | 9,763 | 8,767 | 7,522 | 5,821 |
| 2014 | 5,186 | 5,137 | 5,172 | 6,319 | 7,253 | 7,677 | 8,654 | 9,783 | 9,870 | 9,812 | 8,929 | 7,401 |
| 2015 | 6,495 | 6,294 | 7,299 | 7,545 | 8,528 | 9,097 | 9,144 | 10,130 | 10,213 | 9,418 | 8,600 | 7,129 |
| 2016 | 6,346 | 6,432 | 6,834 | 7,327 | 8,243 | 9,145 | 9,797 | 10,533 | 10,277 | 10,624 | 10,338 | 9,532 |
| 2017 | 9,149 | 9,879 | 8,251 | 8,417 | 8,620 | 8,777 | 8,965 | 10,270 | 9,727 | 10,125 | 9,092 | 7,985 |
| 2018 | 6,937 | 6,199 | 7,362 | 8,139 | 8,729 | 9,577 | 10,868 | 11,653 | 12,143 | 11,202 | 9,794 | 9,524 |
| 2019 | 8,388 | 7,569 | 8,140 | 8,125 | 8,573 | 9,053 | 10,371 | 11,328 | 11,979 | 11,396 | 10,189 | 9,016 |
| 2020 | 8,753 | 8,312 | 8,525 | 8,579 | 8,548 | 9,322 | 10,321 | 11,654 | 11,709 | 10,914 | 6,317 | 6,025 |
| 2021 | 5,587 | 5,258 | 5,610 | 6,034 | 6,291 | 7,283 | 7,892 | 7,853 | 7,710 | 7,191 | 6,251 | 5,706 |
| 2022 | 5,321 | 4,598 | 4,964 | 5,660 | 5,888 | 6,879 | 7,144 | 7,156 | 7,200 | 7,102 | 6,032 | 6,205 |
| 2023 | 5,619 | 5,650 | 5,863 | 5,894 | 5,864 | 6,230 | 6,241 | 6,906 | 7,349 | 7,019 | 6,605 | 5,776 |
| 2024 | 5,473 | |||||||||||
| - = No Data Reported; -- = Not Applicable; NA = Not Available; W = Withheld to avoid disclosure of individual company data. |
| Release Date: 3/29/2024 |
| Next Release Date: 4/30/2024 |