|
Download Data (XLS File) |
|
||||||||
|
||||||||
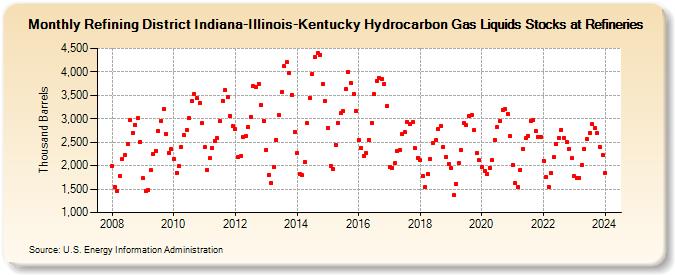
| Refining District Indiana-Illinois-Kentucky Hydrocarbon Gas Liquids Stocks at Refineries (Thousand Barrels) | ||||||||
| Year | Jan | Feb | Mar | Apr | May | Jun | Jul | Aug | Sep | Oct | Nov | Dec |
|---|---|---|---|---|---|---|---|---|---|---|---|---|
| 2008 | 1,989 | 1,543 | 1,458 | 1,775 | 2,145 | 2,224 | 2,456 | 2,970 | 2,704 | 2,867 | 3,006 | 2,508 |
| 2009 | 1,730 | 1,469 | 1,491 | 1,899 | 2,256 | 2,322 | 2,742 | 2,958 | 3,212 | 2,678 | 2,277 | 2,355 |
| 2010 | 2,146 | 1,850 | 1,985 | 2,400 | 2,648 | 2,759 | 3,015 | 3,386 | 3,525 | 3,432 | 3,329 | 2,908 |
| 2011 | 2,393 | 1,911 | 2,156 | 2,373 | 2,530 | 2,580 | 2,947 | 3,382 | 3,609 | 3,456 | 3,068 | 2,844 |
| 2012 | 2,775 | 2,184 | 2,197 | 2,610 | 2,626 | 2,823 | 3,032 | 3,698 | 3,673 | 3,748 | 3,291 | 2,954 |
| 2013 | 2,343 | 1,811 | 1,631 | 1,981 | 2,542 | 3,084 | 3,568 | 4,116 | 4,204 | 3,969 | 3,509 | 2,714 |
| 2014 | 2,268 | 1,824 | 1,797 | 2,087 | 2,906 | 3,447 | 3,958 | 4,318 | 4,401 | 4,363 | 3,737 | 3,368 |
| 2015 | 2,801 | 1,996 | 1,932 | 2,442 | 2,915 | 3,116 | 3,164 | 3,639 | 4,003 | 3,763 | 3,529 | 3,166 |
| 2016 | 2,545 | 2,379 | 2,207 | 2,266 | 2,554 | 2,916 | 3,521 | 3,811 | 3,877 | 3,858 | 3,740 | 3,262 |
| 2017 | 1,967 | 1,959 | 2,048 | 2,322 | 2,340 | 2,668 | 2,710 | 2,931 | 2,888 | 2,925 | 2,371 | 2,168 |
| 2018 | 2,110 | 1,778 | 1,544 | 1,812 | 2,145 | 2,493 | 2,537 | 2,771 | 2,848 | 2,398 | 2,189 | 2,043 |
| 2019 | 1,941 | 1,373 | 1,618 | 2,048 | 2,328 | 2,901 | 2,860 | 3,048 | 3,085 | 2,756 | 2,267 | 2,124 |
| 2020 | 1,976 | 1,891 | 1,828 | 1,957 | 2,115 | 2,554 | 2,814 | 2,956 | 3,192 | 3,205 | 3,100 | 2,629 |
| 2021 | 2,014 | 1,628 | 1,545 | 1,914 | 2,365 | 2,584 | 2,631 | 2,957 | 2,975 | 2,733 | 2,614 | 2,613 |
| 2022 | 2,108 | 1,757 | 1,553 | 1,843 | 2,174 | 2,465 | 2,592 | 2,769 | 2,591 | 2,499 | 2,352 | 2,153 |
| 2023 | 1,779 | 1,729 | 1,737 | 2,016 | 2,364 | 2,558 | 2,697 | 2,881 | 2,801 | 2,696 | 2,404 | 2,228 |
| 2024 | 1,850 | |||||||||||
| - = No Data Reported; -- = Not Applicable; NA = Not Available; W = Withheld to avoid disclosure of individual company data. |
| Release Date: 3/29/2024 |
| Next Release Date: 4/30/2024 |