|
Download Data (XLS File) |
|
||||||||
|
||||||||
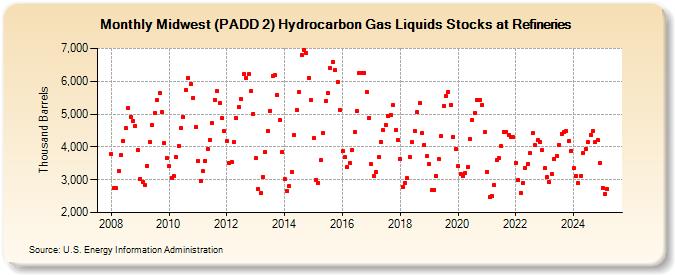
| Midwest (PADD 2) Hydrocarbon Gas Liquids Stocks at Refineries (Thousand Barrels) | ||||||||
| Year | Jan | Feb | Mar | Apr | May | Jun | Jul | Aug | Sep | Oct | Nov | Dec |
|---|---|---|---|---|---|---|---|---|---|---|---|---|
| 2008 | 3,780 | 2,758 | 2,740 | 3,272 | 3,738 | 4,174 | 4,564 | 5,173 | 4,905 | 4,791 | 4,648 | 3,907 |
| 2009 | 3,015 | 2,931 | 2,835 | 3,411 | 4,157 | 4,669 | 5,024 | 5,423 | 5,652 | 5,050 | 4,110 | 3,664 |
| 2010 | 3,415 | 3,060 | 3,100 | 3,697 | 4,033 | 4,569 | 4,900 | 5,742 | 6,108 | 5,918 | 5,501 | 4,603 |
| 2011 | 3,582 | 2,965 | 3,258 | 3,578 | 3,947 | 4,218 | 4,734 | 5,439 | 5,691 | 5,341 | 4,874 | 4,483 |
| 2012 | 4,171 | 3,514 | 3,541 | 4,157 | 4,870 | 5,214 | 5,449 | 6,213 | 6,102 | 6,210 | 5,709 | 5,015 |
| 2013 | 3,659 | 2,713 | 2,590 | 3,095 | 3,839 | 4,495 | 5,108 | 6,154 | 6,176 | 5,575 | 4,814 | 3,843 |
| 2014 | 3,027 | 2,660 | 2,808 | 3,227 | 4,358 | 5,125 | 5,661 | 6,806 | 6,956 | 6,868 | 6,111 | 5,427 |
| 2015 | 4,267 | 3,001 | 2,903 | 3,589 | 4,421 | 5,395 | 5,631 | 6,399 | 6,582 | 6,338 | 5,973 | 5,115 |
| 2016 | 3,864 | 3,679 | 3,373 | 3,514 | 3,907 | 4,459 | 5,089 | 6,253 | 6,257 | 6,264 | 5,660 | 4,889 |
| 2017 | 3,471 | 3,118 | 3,231 | 3,690 | 4,149 | 4,509 | 4,666 | 4,948 | 4,981 | 5,274 | 4,513 | 4,213 |
| 2018 | 3,633 | 2,787 | 2,915 | 3,042 | 3,690 | 4,136 | 4,494 | 5,048 | 5,340 | 4,418 | 4,068 | 3,709 |
| 2019 | 3,474 | 2,679 | 2,691 | 3,114 | 3,630 | 4,330 | 5,253 | 5,536 | 5,679 | 5,291 | 4,305 | 3,942 |
| 2020 | 3,410 | 3,179 | 3,104 | 3,195 | 3,381 | 4,247 | 4,829 | 5,027 | 5,418 | 5,442 | 5,288 | 4,445 |
| 2021 | 3,248 | 2,463 | 2,501 | 2,842 | 3,601 | 3,651 | 4,016 | 4,454 | 4,462 | 4,372 | 4,302 | 4,288 |
| 2022 | 3,523 | 2,984 | 2,608 | 2,907 | 3,365 | 3,483 | 3,804 | 4,413 | 4,054 | 4,205 | 4,150 | 3,897 |
| 2023 | 3,353 | 3,070 | 3,020 | 3,152 | 3,603 | 3,700 | 4,068 | 4,402 | 4,439 | 4,487 | 4,184 | 3,885 |
| 2024 | 3,349 | 3,117 | 2,902 | 3,109 | ||||||||
| - = No Data Reported; -- = Not Applicable; NA = Not Available; W = Withheld to avoid disclosure of individual company data. |
| Release Date: 6/28/2024 |
| Next Release Date: 7/31/2024 |