|
Download Data (XLS File) |
|
||||||||
|
||||||||
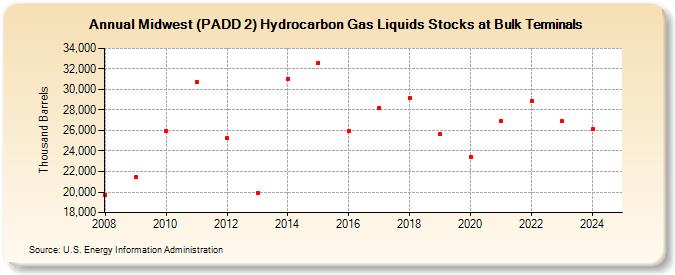
| Midwest (PADD 2) Hydrocarbon Gas Liquids Stocks at Bulk Terminals (Thousand Barrels) | ||||||||
| Decade | Year-0 | Year-1 | Year-2 | Year-3 | Year-4 | Year-5 | Year-6 | Year-7 | Year-8 | Year-9 |
|---|---|---|---|---|---|---|---|---|---|---|
| 2000's | 19,715 | 21,461 | ||||||||
| 2010's | 25,977 | 30,702 | 25,224 | 19,945 | 31,027 | 32,620 | 25,916 | 28,235 | 29,178 | 25,648 |
| 2020's | 23,452 | 26,941 | 28,918 | 26,881 |
| - = No Data Reported; -- = Not Applicable; NA = Not Available; W = Withheld to avoid disclosure of individual company data. |
| Release Date: 3/29/2024 |
| Next Release Date: 8/30/2024 |