|
Download Data (XLS File) |
|
||||||||
|
||||||||
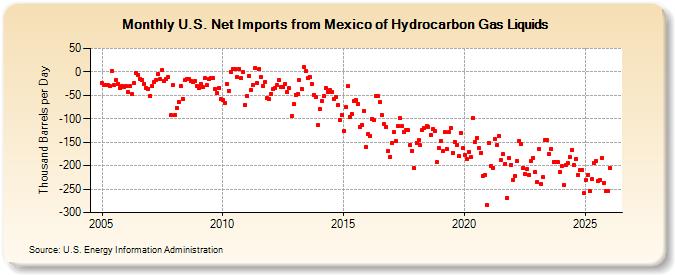
| U.S. Net Imports from Mexico of Hydrocarbon Gas Liquids (Thousand Barrels per Day) | ||||||||
| Year | Jan | Feb | Mar | Apr | May | Jun | Jul | Aug | Sep | Oct | Nov | Dec |
|---|---|---|---|---|---|---|---|---|---|---|---|---|
| 2005 | -23 | -29 | -27 | -29 | -31 | 2 | -28 | -17 | -25 | -35 | -31 | -32 |
| 2006 | -31 | -43 | -31 | -48 | -23 | -3 | -6 | -16 | -17 | -25 | -34 | -37 |
| 2007 | -52 | -31 | -21 | -18 | -5 | -16 | 3 | -20 | -16 | -11 | -93 | -29 |
| 2008 | -93 | -77 | -65 | -30 | -57 | -18 | -15 | -15 | -20 | -21 | -19 | -30 |
| 2009 | -34 | -26 | -33 | -14 | -29 | -15 | -13 | -13 | -36 | -45 | -34 | -58 |
| 2010 | -60 | -66 | -25 | -40 | 0 | 6 | 6 | -11 | 6 | -14 | -1 | -71 |
| 2011 | -51 | -8 | -38 | -27 | 8 | -23 | 6 | -12 | -30 | -21 | -56 | -58 |
| 2012 | -47 | -37 | -34 | -29 | -17 | -33 | -33 | -25 | -43 | -35 | -95 | -69 |
| 2013 | -49 | -48 | -18 | -36 | 10 | 1 | -14 | -10 | -25 | -49 | -54 | -114 |
| 2014 | -80 | -62 | -52 | -34 | -42 | -39 | -42 | -57 | -53 | -71 | -102 | -92 |
| 2015 | -127 | -75 | -31 | -96 | -89 | -63 | -61 | -68 | -117 | -113 | -83 | -160 |
| 2016 | -133 | -137 | -100 | -103 | -52 | -52 | -64 | -93 | -111 | -118 | -169 | -181 |
| 2017 | -151 | -129 | -148 | -115 | -99 | -116 | -129 | -125 | -124 | -155 | -168 | -206 |
| 2018 | -151 | -146 | -157 | -124 | -119 | -116 | -117 | -134 | -122 | -127 | -193 | -162 |
| 2019 | -147 | -169 | -129 | -164 | -129 | -119 | -172 | -149 | -155 | -180 | -130 | -163 |
| 2020 | -177 | -186 | -170 | -182 | -98 | -149 | -140 | -163 | -172 | -221 | -219 | -284 |
| 2021 | -151 | -200 | -205 | -143 | -157 | -137 | -188 | -176 | -196 | -269 | -183 | -198 |
| 2022 | -230 | -222 | -190 | -147 | -154 | -204 | -218 | -208 | -220 | -190 | -183 | -213 |
| 2023 | -225 | -171 | -270 | -202 | -145 | -145 | -176 | -164 | -192 | -192 | -192 | -214 |
| 2024 | -201 | |||||||||||
| - = No Data Reported; -- = Not Applicable; NA = Not Available; W = Withheld to avoid disclosure of individual company data. |
| Release Date: 3/29/2024 |
| Next Release Date: 4/30/2024 |