|
Download Data (XLS File) |
|
||||||||
|
||||||||
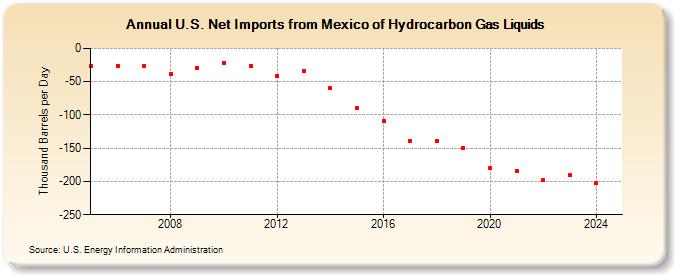
| U.S. Net Imports from Mexico of Hydrocarbon Gas Liquids (Thousand Barrels per Day) | ||||||||
| Decade | Year-0 | Year-1 | Year-2 | Year-3 | Year-4 | Year-5 | Year-6 | Year-7 | Year-8 | Year-9 |
|---|---|---|---|---|---|---|---|---|---|---|
| 2000's | -26 | -26 | -26 | -38 | -29 | |||||
| 2010's | -22 | -26 | -41 | -34 | -60 | -90 | -109 | -139 | -139 | -150 |
| 2020's | -180 | -184 | -198 | -191 |
| - = No Data Reported; -- = Not Applicable; NA = Not Available; W = Withheld to avoid disclosure of individual company data. |
| Release Date: 6/28/2024 |
| Next Release Date: 8/30/2024 |