|
Download Data (XLS File) |
|
||||||||
|
||||||||
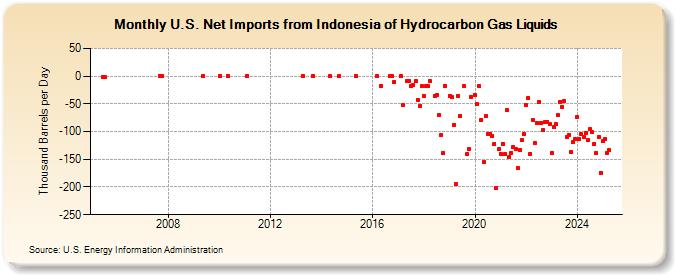
| U.S. Net Imports from Indonesia of Hydrocarbon Gas Liquids (Thousand Barrels per Day) | ||||||||
| Year | Jan | Feb | Mar | Apr | May | Jun | Jul | Aug | Sep | Oct | Nov | Dec |
|---|---|---|---|---|---|---|---|---|---|---|---|---|
| 2005 | -2 | -2 | ||||||||||
| 2007 | 0 | 0 | ||||||||||
| 2009 | 0 | |||||||||||
| 2010 | 0 | 0 | ||||||||||
| 2011 | 0 | |||||||||||
| 2013 | 0 | 0 | ||||||||||
| 2014 | 0 | 0 | ||||||||||
| 2015 | 0 | |||||||||||
| 2016 | 0 | -18 | 0 | 0 | -10 | |||||||
| 2017 | 0 | -53 | -9 | -8 | -17 | -16 | -9 | -43 | -54 | -17 | ||
| 2018 | -36 | -18 | -18 | -9 | -35 | -34 | -71 | -107 | -139 | -18 | ||
| 2019 | -35 | -38 | -88 | -195 | -35 | -72 | -18 | -141 | -132 | -37 | ||
| 2020 | -34 | -51 | -18 | -79 | -155 | -72 | -104 | -104 | -108 | -122 | -202 | -132 |
| 2021 | -140 | -122 | -141 | -62 | -146 | -139 | -127 | -131 | -165 | -133 | -116 | -104 |
| 2022 | -53 | -39 | -140 | -79 | -121 | -85 | -46 | -84 | -97 | -82 | -82 | -87 |
| 2023 | -128 | -97 | -87 | -71 | -49 | -51 | -45 | -110 | -106 | -137 | -117 | -117 |
| 2024 | -74 | |||||||||||
| - = No Data Reported; -- = Not Applicable; NA = Not Available; W = Withheld to avoid disclosure of individual company data. |
| Release Date: 3/29/2024 |
| Next Release Date: 4/30/2024 |