|
Download Data (XLS File) |
|
||||||||
|
||||||||
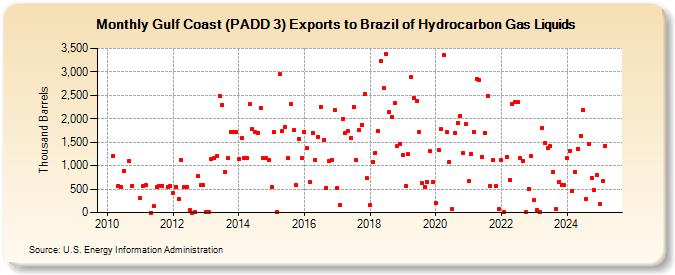
| Gulf Coast (PADD 3) Exports to Brazil of Hydrocarbon Gas Liquids (Thousand Barrels) | ||||||||
| Year | Jan | Feb | Mar | Apr | May | Jun | Jul | Aug | Sep | Oct | Nov | Dec |
|---|---|---|---|---|---|---|---|---|---|---|---|---|
| 2010 | 1,205 | 572 | 550 | 892 | 1,096 | 569 | ||||||
| 2011 | 312 | 572 | 577 | 0 | 133 | 554 | 572 | 576 | 555 | 575 | ||
| 2012 | 410 | 555 | 298 | 1,114 | 547 | 546 | 53 | 1 | 6 | 780 | 582 | 579 |
| 2013 | 2 | 6 | 1,139 | 1,155 | 1,205 | 2,476 | 2,301 | 861 | 1,154 | 1,707 | 1,724 | 1,725 |
| 2014 | 1,146 | 1,588 | 1,154 | 1,159 | 2,304 | 1,777 | 1,718 | 1,699 | 2,239 | 1,155 | 1,155 | 1,118 |
| 2015 | 551 | 1,724 | 6 | 2,953 | 1,733 | 1,823 | 1,163 | 2,321 | 1,765 | 580 | 1,567 | 1,160 |
| 2016 | 1,708 | 1,369 | 656 | 1,703 | 1,131 | 1,611 | 2,251 | 1,543 | 526 | 1,101 | 1,127 | 2,185 |
| 2017 | 522 | 164 | 1,999 | 1,698 | 1,734 | 1,598 | 2,258 | 1,124 | 1,753 | 1,874 | 2,538 | 729 |
| 2018 | 151 | 1,078 | 1,276 | 1,735 | 3,237 | 2,653 | 3,377 | 2,138 | 2,042 | 2,326 | 1,425 | 1,469 |
| 2019 | 1,227 | 562 | 1,239 | 2,892 | 2,443 | 2,387 | 1,710 | 629 | 547 | 649 | 1,302 | 652 |
| 2020 | 204 | 1,331 | 1,775 | 3,355 | 1,720 | 1,087 | 79 | 1,702 | 1,913 | 2,055 | 1,261 | 1,882 |
| 2021 | 664 | 1,259 | 1,713 | 2,855 | 2,821 | 1,182 | 1,704 | 2,487 | 574 | 1,111 | 564 | 77 |
| 2022 | 1,123 | 2 | 1,190 | 694 | 2,320 | 2,357 | 2,360 | 1,160 | 1,093 | 3 | 500 | 1,201 |
| 2023 | 263 | 64 | 3 | 1,806 | 1,473 | 1,372 | 1,418 | 874 | 78 | 654 | 579 | 582 |
| 2024 | 1,158 | 1,316 | 462 | 866 | 1,362 | 1,634 | 2,187 | 288 | 1,472 | 741 | 488 | 804 |
| 2025 | 193 | 664 | 1,422 | 1,736 | ||||||||
| - = No Data Reported; -- = Not Applicable; NA = Not Available; W = Withheld to avoid disclosure of individual company data. |
| Release Date: 6/30/2025 |
| Next Release Date: 7/31/2025 |