|
Download Data (XLS File) |
|
||||||||
|
||||||||
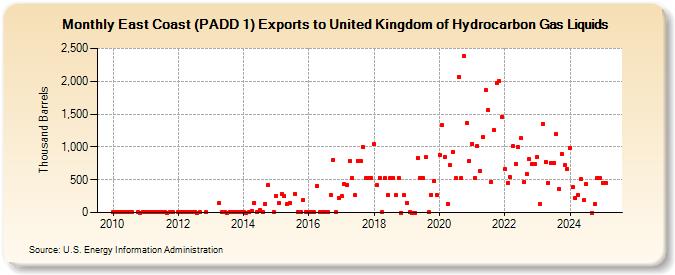
| East Coast (PADD 1) Exports to United Kingdom of Hydrocarbon Gas Liquids (Thousand Barrels) | ||||||||
| Year | Jan | Feb | Mar | Apr | May | Jun | Jul | Aug | Sep | Oct | Nov | Dec |
|---|---|---|---|---|---|---|---|---|---|---|---|---|
| 2010 | 1 | 2 | 3 | 2 | 1 | 2 | 2 | 1 | 2 | 0 | 2 | |
| 2011 | 1 | 1 | 3 | 2 | 1 | 1 | 1 | 1 | 0 | 1 | 2 | |
| 2012 | 1 | 2 | 1 | 1 | 4 | 5 | 2 | 0 | 1 | 1 | ||
| 2013 | 146 | 4 | 1 | 0 | 1 | 1 | 1 | 1 | 1 | |||
| 2014 | 1 | 0 | 3 | 19 | 153 | 8 | 36 | 1 | 137 | 420 | 1 | |
| 2015 | 245 | 144 | 288 | 245 | 124 | 152 | 287 | 5 | 3 | 193 | 5 | |
| 2016 | 3 | 4 | 3 | 408 | 3 | 7 | 4 | 3 | 274 | 806 | 1 | 221 |
| 2017 | 253 | 430 | 422 | 791 | 526 | 263 | 787 | 788 | 996 | 525 | 527 | 525 |
| 2018 | 1,037 | 413 | 530 | 2 | 530 | 266 | 529 | 530 | 266 | 529 | 0 | 264 |
| 2019 | 149 | 1 | 0 | 0 | 833 | 531 | 526 | 841 | 1 | 268 | 475 | 267 |
| 2020 | 875 | 1,329 | 849 | 131 | 720 | 926 | 528 | 2,070 | 525 | 2,386 | 1,370 | 788 |
| 2021 | 1,050 | 526 | 1,008 | 626 | 1,150 | 1,866 | 1,559 | 460 | 1,254 | 1,968 | 2,001 | 1,461 |
| 2022 | 659 | 454 | 537 | 1,006 | 745 | 994 | 1,128 | 469 | 588 | 814 | 737 | 736 |
| 2023 | 842 | 123 | 1,337 | 771 | 457 | 756 | 754 | 1,192 | 356 | 898 | 721 | 670 |
| 2024 | 983 | |||||||||||
| - = No Data Reported; -- = Not Applicable; NA = Not Available; W = Withheld to avoid disclosure of individual company data. |
| Release Date: 3/29/2024 |
| Next Release Date: 4/30/2024 |