|
Download Data (XLS File) |
|
||||||||
|
||||||||
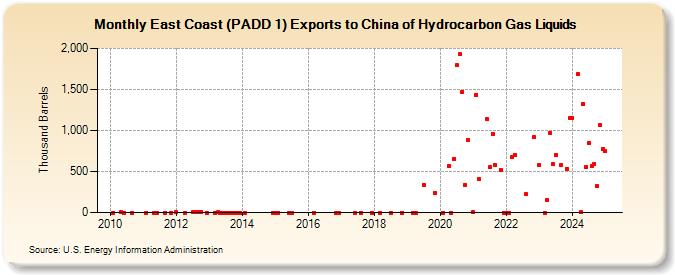
| East Coast (PADD 1) Exports to China of Hydrocarbon Gas Liquids (Thousand Barrels) | ||||||||
| Year | Jan | Feb | Mar | Apr | May | Jun | Jul | Aug | Sep | Oct | Nov | Dec |
|---|---|---|---|---|---|---|---|---|---|---|---|---|
| 2010 | 0 | 1 | 0 | 0 | ||||||||
| 2011 | 0 | 0 | 0 | 0 | 0 | |||||||
| 2012 | 2 | 0 | 1 | 1 | 1 | 1 | 0 | |||||
| 2013 | 0 | 1 | 0 | 0 | 0 | 0 | 0 | 0 | 0 | 0 | ||
| 2014 | 0 | 0 | ||||||||||
| 2015 | 0 | 0 | 0 | 0 | ||||||||
| 2016 | 0 | 0 | 0 | |||||||||
| 2017 | 0 | 0 | 0 | |||||||||
| 2018 | 0 | 0 | 0 | |||||||||
| 2019 | 0 | 0 | 340 | 243 | ||||||||
| 2020 | 0 | 567 | 0 | 654 | 1,792 | 1,926 | 1,473 | 341 | 878 | |||
| 2021 | 1 | 1,436 | 407 | 1,137 | 550 | 958 | 574 | 523 | 0 | |||
| 2022 | 0 | 0 | 677 | 706 | 222 | 920 | ||||||
| 2023 | 579 | 0 | 286 | 973 | 587 | 705 | 577 | 537 | 1,154 | |||
| 2024 | 1,158 | |||||||||||
| - = No Data Reported; -- = Not Applicable; NA = Not Available; W = Withheld to avoid disclosure of individual company data. |
| Release Date: 3/29/2024 |
| Next Release Date: 4/30/2024 |