|
Download Data (XLS File) |
|
||||||||
|
||||||||
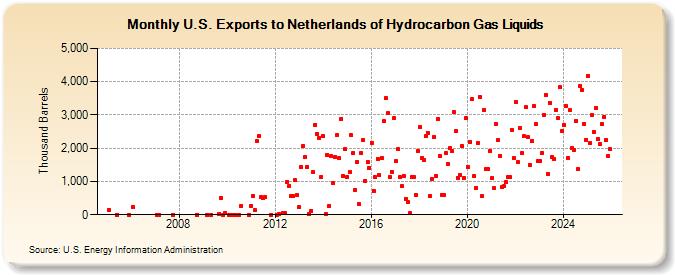
| U.S. Exports to Netherlands of Hydrocarbon Gas Liquids (Thousand Barrels) | ||||||||
| Year | Jan | Feb | Mar | Apr | May | Jun | Jul | Aug | Sep | Oct | Nov | Dec |
|---|---|---|---|---|---|---|---|---|---|---|---|---|
| 2005 | 137 | 0 | 0 | |||||||||
| 2006 | 242 | |||||||||||
| 2007 | 0 | 0 | 1 | |||||||||
| 2008 | 0 | |||||||||||
| 2009 | 0 | 0 | 32 | 500 | 0 | 47 | ||||||
| 2010 | 1 | 1 | 0 | 0 | 0 | 273 | 0 | |||||
| 2011 | 270 | 571 | 139 | 2,203 | 2,366 | 532 | 500 | 520 | 0 | |||
| 2012 | 0 | 8 | 37 | 37 | 993 | 866 | 559 | 569 | 1,030 | 591 | ||
| 2013 | 228 | 1,448 | 2,070 | 1,725 | 1,446 | 27 | 118 | 1,280 | 2,709 | 2,426 | 2,318 | 1,147 |
| 2014 | 2,355 | 17 | 1,802 | 265 | 1,759 | 958 | 1,735 | 2,389 | 1,701 | 2,878 | 1,164 | 1,967 |
| 2015 | 1,140 | 1,273 | 2,388 | 1,848 | 742 | 1,585 | 313 | 1,848 | 2,242 | 1,023 | 1,584 | 1,417 |
| 2016 | 2,165 | 716 | 1,128 | 1,685 | 1,196 | 1,704 | 2,816 | 3,516 | 3,045 | 1,138 | 1,293 | 2,896 |
| 2017 | 1,601 | 1,963 | 1,131 | 856 | 1,158 | 483 | 395 | 41 | 1,140 | 1,143 | 587 | 1,928 |
| 2018 | 2,640 | 1,705 | 1,642 | 2,352 | 2,464 | 567 | 1,072 | 2,341 | 1,171 | 2,884 | 1,769 | 598 |
| 2019 | 606 | 1,861 | 1,518 | 1,994 | 1,909 | 3,092 | 2,509 | 1,115 | 1,190 | 2,077 | 1,111 | 2,899 |
| 2020 | 1,443 | 2,174 | 3,467 | 1,149 | 816 | 2,159 | 3,550 | 549 | 3,161 | 1,366 | 1,376 | 1,921 |
| 2021 | 1,091 | 793 | 2,732 | 2,233 | 1,777 | 826 | 849 | 980 | 1,129 | 1,133 | 2,559 | 1,703 |
| 2022 | 3,394 | 1,573 | 2,592 | 1,846 | 2,356 | 3,230 | 2,327 | 1,499 | 2,229 | 3,275 | 2,720 | 1,613 |
| 2023 | 2,250 | 1,870 | 3,006 | 3,964 | 972 | 3,361 | 2,121 | 1,676 | 3,414 | 2,606 | 3,825 | 2,495 |
| 2024 | 2,705 | |||||||||||
| - = No Data Reported; -- = Not Applicable; NA = Not Available; W = Withheld to avoid disclosure of individual company data. |
| Release Date: 3/29/2024 |
| Next Release Date: 4/30/2024 |