|
Download Data (XLS File) |
|
||||||||
|
||||||||
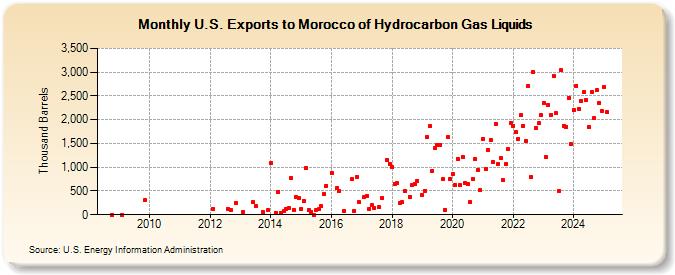
| U.S. Exports to Morocco of Hydrocarbon Gas Liquids (Thousand Barrels) | ||||||||
| Year | Jan | Feb | Mar | Apr | May | Jun | Jul | Aug | Sep | Oct | Nov | Dec |
|---|---|---|---|---|---|---|---|---|---|---|---|---|
| 2008 | 0 | |||||||||||
| 2009 | 1 | 300 | ||||||||||
| 2012 | 128 | 128 | 109 | 252 | ||||||||
| 2013 | 64 | 262 | 180 | 50 | 99 | |||||||
| 2014 | 1,080 | 45 | 484 | 39 | 74 | 130 | 139 | 772 | 109 | 367 | 352 | |
| 2015 | 126 | 291 | 986 | 92 | 57 | 0 | 102 | 112 | 178 | 431 | 610 | |
| 2016 | 884 | 561 | 503 | 75 | 744 | 85 | 800 | 264 | ||||
| 2017 | 379 | 396 | 130 | 198 | 136 | 162 | 361 | 1,157 | 1,073 | |||
| 2018 | 1,008 | 648 | 658 | 254 | 262 | 494 | 380 | 631 | 650 | 716 | ||
| 2019 | 421 | 508 | 1,629 | 1,866 | 925 | 1,402 | 1,475 | 1,458 | 743 | 101 | 1,637 | 762 |
| 2020 | 848 | 622 | 1,181 | 618 | 1,218 | 672 | 652 | 265 | 752 | 1,172 | 950 | 517 |
| 2021 | 1,602 | 967 | 1,372 | 1,567 | 1,110 | 1,919 | 1,072 | 1,187 | 720 | 1,063 | 1,373 | 1,940 |
| 2022 | 1,873 | 1,736 | 1,600 | 2,089 | 1,875 | 1,559 | 2,713 | 798 | 3,004 | 1,821 | 1,924 | 2,088 |
| 2023 | 2,349 | 1,213 | 2,310 | 2,096 | 2,925 | 2,132 | 494 | 3,036 | 1,874 | 1,856 | 2,464 | 1,486 |
| 2024 | 2,200 | 2,716 | 2,230 | 2,400 | 2,577 | 2,416 | ||||||
| - = No Data Reported; -- = Not Applicable; NA = Not Available; W = Withheld to avoid disclosure of individual company data. |
| Release Date: 8/30/2024 |
| Next Release Date: 9/30/2024 |