|
Download Data (XLS File) |
|
||||||||
|
||||||||
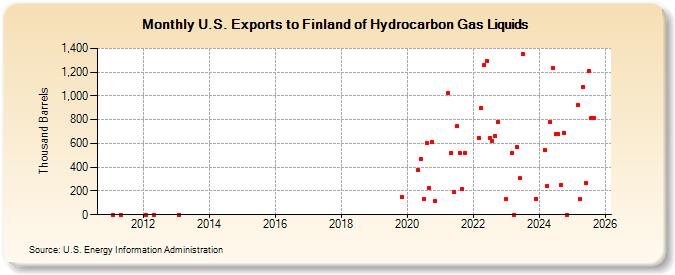
| U.S. Exports to Finland of Hydrocarbon Gas Liquids (Thousand Barrels) | ||||||||
| Year | Jan | Feb | Mar | Apr | May | Jun | Jul | Aug | Sep | Oct | Nov | Dec |
|---|---|---|---|---|---|---|---|---|---|---|---|---|
| 2011 | 0 | 0 | ||||||||||
| 2012 | 0 | 0 | ||||||||||
| 2013 | 0 | |||||||||||
| 2019 | 150 | |||||||||||
| 2020 | 380 | 470 | 130 | 603 | 222 | 616 | 112 | |||||
| 2021 | 1,025 | 523 | 195 | 743 | 522 | 216 | 523 | |||||
| 2022 | 648 | 902 | 1,258 | 1,293 | 646 | 622 | 661 | 784 | ||||
| 2023 | 134 | 1,044 | 642 | 55 | 305 | 1,350 | 134 | |||||
| - = No Data Reported; -- = Not Applicable; NA = Not Available; W = Withheld to avoid disclosure of individual company data. |
| Release Date: 3/29/2024 |
| Next Release Date: 4/30/2024 |