|
Download Data (XLS File) |
|
||||||||
|
||||||||
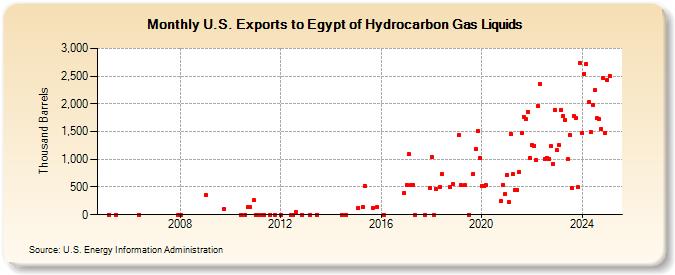
| U.S. Exports to Egypt of Hydrocarbon Gas Liquids (Thousand Barrels) | ||||||||
| Year | Jan | Feb | Mar | Apr | May | Jun | Jul | Aug | Sep | Oct | Nov | Dec |
|---|---|---|---|---|---|---|---|---|---|---|---|---|
| 2005 | 0 | 1 | ||||||||||
| 2006 | 0 | |||||||||||
| 2007 | 0 | |||||||||||
| 2008 | 0 | |||||||||||
| 2009 | 360 | 100 | ||||||||||
| 2010 | 0 | 0 | 134 | 136 | 257 | |||||||
| 2011 | 1 | 0 | 0 | 0 | 0 | 0 | ||||||
| 2012 | 0 | 1 | 0 | 42 | 0 | |||||||
| 2013 | 0 | 0 | ||||||||||
| 2014 | 0 | 0 | ||||||||||
| 2015 | 130 | 143 | 523 | 126 | 134 | |||||||
| 2016 | 0 | 389 | ||||||||||
| 2017 | 537 | 1,093 | 539 | 544 | 0 | 0 | 485 | |||||
| 2018 | 1,046 | 0 | 468 | 498 | 730 | 499 | 546 | |||||
| 2019 | 1,441 | 538 | 531 | 0 | 738 | 1,181 | 1,512 | 1,017 | ||||
| 2020 | 526 | 517 | 529 | 240 | 542 | 371 | ||||||
| 2021 | 716 | 221 | 1,453 | 738 | 444 | 445 | 766 | 1,472 | 1,763 | 1,721 | 1,861 | 1,026 |
| 2022 | 1,255 | 1,246 | 981 | 1,960 | 2,355 | 1,001 | 1,028 | 1,005 | 1,232 | 921 | 1,893 | |
| 2023 | 1,159 | 1,772 | 1,819 | 1,789 | 1,710 | 1,346 | 1,098 | 484 | 1,776 | 1,583 | 494 | 2,734 |
| 2024 | 1,482 | |||||||||||
| - = No Data Reported; -- = Not Applicable; NA = Not Available; W = Withheld to avoid disclosure of individual company data. |
| Release Date: 3/29/2024 |
| Next Release Date: 4/30/2024 |