|
Download Data (XLS File) |
|
||||||||
|
||||||||
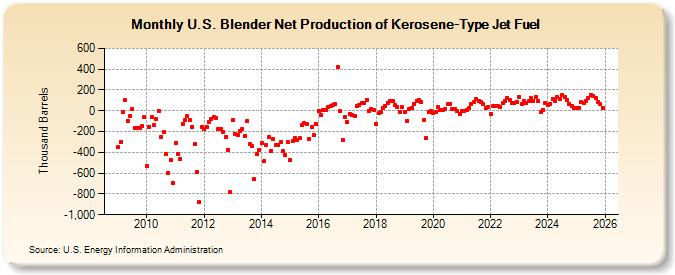
| U.S. Blender Net Production of Kerosene-Type Jet Fuel (Thousand Barrels) | ||||||||
| Year | Jan | Feb | Mar | Apr | May | Jun | Jul | Aug | Sep | Oct | Nov | Dec |
|---|---|---|---|---|---|---|---|---|---|---|---|---|
| 2009 | -351 | -296 | -10 | 100 | -95 | -47 | 13 | -164 | -165 | -166 | -146 | -62 |
| 2010 | -534 | -155 | -63 | -138 | -82 | 2 | -248 | -208 | -412 | -597 | -477 | -691 |
| 2011 | -312 | -414 | -463 | -123 | -93 | -55 | -90 | -153 | -319 | -593 | -881 | -154 |
| 2012 | -180 | -152 | -104 | -76 | -64 | -70 | -174 | -171 | -201 | -250 | -376 | -783 |
| 2013 | -91 | -225 | -236 | -192 | -180 | -238 | -97 | -320 | -340 | -658 | -416 | -380 |
| 2014 | -311 | -485 | -326 | -257 | -389 | -272 | -334 | -329 | -296 | -386 | -422 | -302 |
| 2015 | -470 | -291 | -264 | -283 | -266 | -140 | -118 | -130 | -271 | -156 | -234 | -123 |
| 2016 | -1 | -41 | 5 | 12 | 33 | 45 | 58 | 62 | 420 | -7 | -283 | -58 |
| 2017 | -108 | -30 | -45 | -52 | 43 | 57 | 74 | 70 | 106 | -7 | 15 | 6 |
| 2018 | -126 | -24 | -8 | 22 | 48 | 78 | 96 | 96 | 51 | 33 | -11 | 32 |
| 2019 | -11 | -94 | 15 | 29 | 63 | 93 | 108 | 85 | -87 | -266 | -13 | 2 |
| 2020 | -20 | -10 | 35 | 3 | 8 | 14 | 64 | 66 | 21 | 14 | 2 | -29 |
| 2021 | 1 | -7 | 12 | 24 | 69 | 83 | 112 | 94 | 82 | 61 | 25 | 34 |
| 2022 | -28 | 42 | 43 | 46 | 37 | 70 | 91 | 127 | 106 | 74 | 76 | 82 |
| 2023 | 136 | 78 | 98 | 79 | 90 | 122 | 95 | 133 | 94 | -10 | 10 | 70 |
| 2024 | 52 | |||||||||||
| - = No Data Reported; -- = Not Applicable; NA = Not Available; W = Withheld to avoid disclosure of individual company data. |
| Release Date: 3/29/2024 |
| Next Release Date: 4/30/2024 |