|
Download Data (XLS File) |
|
||||||||
|
||||||||
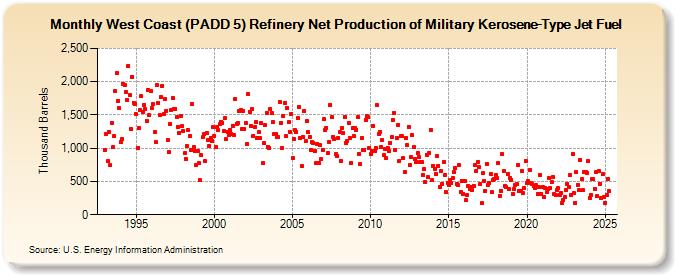
| West Coast (PADD 5) Refinery Net Production of Military Kerosene-Type Jet Fuel (Thousand Barrels) | ||||||||
| Year | Jan | Feb | Mar | Apr | May | Jun | Jul | Aug | Sep | Oct | Nov | Dec |
|---|---|---|---|---|---|---|---|---|---|---|---|---|
| 1993 | 971 | 1,217 | 806 | 1,250 | 743 | 1,386 | 1,014 | 1,179 | 1,862 | 2,127 | 1,712 | 1,597 |
| 1994 | 1,096 | 1,138 | 1,970 | 1,954 | 1,851 | 1,728 | 2,241 | 1,795 | 1,290 | 2,075 | 1,685 | 1,671 |
| 1995 | 1,508 | 1,008 | 1,307 | 1,569 | 1,780 | 1,543 | 1,656 | 1,585 | 1,405 | 1,879 | 1,492 | 1,865 |
| 1996 | 1,598 | 1,663 | 1,243 | 1,089 | 1,953 | 1,681 | 1,492 | 1,768 | 1,940 | 1,512 | 1,742 | 1,566 |
| 1997 | 1,121 | 938 | 1,363 | 1,578 | 1,761 | 1,590 | 1,592 | 1,467 | 1,323 | 1,232 | 1,480 | 1,326 |
| 1998 | 1,265 | 922 | 838 | 1,026 | 1,269 | 1,187 | 969 | 1,660 | 1,013 | 961 | 754 | 957 |
| 1999 | 770 | 517 | 891 | 1,163 | 1,207 | 803 | 1,225 | 1,119 | 1,039 | 1,156 | 1,112 | 1,321 |
| 2000 | 1,184 | 1,017 | 1,314 | 1,266 | 1,358 | 1,399 | 1,386 | 1,253 | 1,452 | 1,133 | 1,247 | 1,198 |
| 2001 | 1,278 | 1,219 | 1,340 | 1,191 | 1,741 | 1,371 | 1,374 | 1,564 | 1,579 | 1,294 | 1,555 | 1,289 |
| 2002 | 1,383 | 1,068 | 1,808 | 1,550 | 1,331 | 1,591 | 1,189 | 1,320 | 1,393 | 1,160 | 1,238 | 1,147 |
| 2003 | 1,377 | 775 | 1,074 | 1,342 | 1,530 | 1,024 | 1,006 | 1,590 | 1,535 | 1,393 | 1,212 | 1,215 |
| 2004 | 1,161 | 1,161 | 1,699 | 1,383 | 1,005 | 1,483 | 1,676 | 1,182 | 1,604 | 1,390 | 1,249 | 1,519 |
| 2005 | 849 | 1,141 | 1,268 | 1,250 | 1,456 | 1,620 | 1,151 | 739 | 1,170 | 1,557 | 1,102 | 1,412 |
| 2006 | 1,241 | 1,174 | 980 | 1,097 | 1,079 | 956 | 773 | 1,066 | 784 | 1,043 | 837 | 976 |
| 2007 | 1,432 | 1,271 | 1,309 | 924 | 1,096 | 1,653 | 1,467 | 1,170 | 1,139 | 907 | 879 | 1,159 |
| 2008 | 1,244 | 807 | 1,310 | 1,231 | 1,466 | 1,075 | 1,109 | 1,386 | 1,158 | 771 | 1,297 | 1,176 |
| 2009 | 1,306 | 1,274 | 1,466 | 913 | 756 | 1,157 | 969 | 972 | 1,428 | 1,487 | 1,462 | 1,000 |
| 2010 | 906 | 951 | 1,340 | 951 | 1,008 | 1,644 | 1,213 | 1,243 | 1,019 | 1,117 | 893 | 995 |
| 2011 | 848 | 1,005 | 955 | 1,078 | 1,163 | 1,427 | 1,536 | 974 | 1,149 | 1,347 | 813 | 1,176 |
| 2012 | 1,177 | 849 | 640 | 1,151 | 1,042 | 1,325 | 752 | 863 | 1,198 | 1,015 | 842 | 794 |
| 2013 | 928 | 870 | 791 | 798 | 601 | 684 | 494 | 902 | 563 | 927 | 1,280 | 519 |
| 2014 | 738 | 691 | 612 | 885 | 737 | 413 | 656 | 462 | 794 | 597 | 338 | 483 |
| 2015 | 450 | 519 | 481 | 551 | 637 | 697 | 463 | 448 | 740 | 348 | 512 | 316 |
| 2016 | 503 | 216 | 289 | 434 | 383 | 416 | 372 | 439 | 740 | 662 | 789 | 717 |
| 2017 | 462 | 169 | 621 | 513 | 359 | 769 | 454 | 471 | 617 | 336 | 528 | 530 |
| 2018 | 595 | 549 | 776 | 288 | 362 | 912 | 654 | 439 | 417 | 606 | 379 | 555 |
| 2019 | 528 | 315 | 385 | 450 | 459 | 744 | 351 | 358 | 658 | 323 | 395 | 805 |
| 2020 | 474 | 502 | 674 | 481 | 469 | 426 | 409 | 446 | 316 | 416 | 591 | 312 |
| 2021 | 416 | 266 | 403 | 337 | 387 | 545 | 399 | 488 | 572 | 311 | 298 | 373 |
| 2022 | 395 | 298 | 325 | 175 | 215 | 267 | 378 | 468 | 419 | 598 | 301 | 914 |
| 2023 | 319 | 179 | 639 | 451 | 367 | 823 | 531 | 364 | 648 | 647 | 631 | 806 |
| 2024 | 252 | |||||||||||
| - = No Data Reported; -- = Not Applicable; NA = Not Available; W = Withheld to avoid disclosure of individual company data. |
| Release Date: 3/29/2024 |
| Next Release Date: 4/30/2024 |