|
Download Data (XLS File) |
|
||||||||
|
||||||||
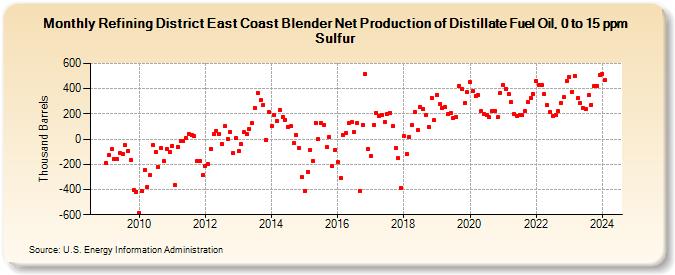
| Refining District East Coast Blender Net Production of Distillate Fuel Oil, 0 to 15 ppm Sulfur (Thousand Barrels) | ||||||||
| Year | Jan | Feb | Mar | Apr | May | Jun | Jul | Aug | Sep | Oct | Nov | Dec |
|---|---|---|---|---|---|---|---|---|---|---|---|---|
| 2009 | -190 | -128 | -82 | -160 | -161 | -114 | -117 | -49 | -92 | -167 | -406 | -417 |
| 2010 | -585 | -413 | -244 | -382 | -286 | -48 | -99 | -223 | -70 | -177 | -77 | -99 |
| 2011 | -52 | -365 | -61 | -17 | -14 | 7 | 43 | 33 | 24 | -174 | -172 | -287 |
| 2012 | -211 | -198 | -75 | 39 | 65 | 39 | -42 | 103 | 2 | 57 | -114 | 6 |
| 2013 | -96 | -42 | 53 | 38 | 80 | 124 | 247 | 368 | 307 | 272 | -5 | 214 |
| 2014 | 104 | 190 | 146 | 229 | 179 | 154 | 99 | 100 | -31 | 30 | -70 | -302 |
| 2015 | -413 | -259 | -84 | -173 | 127 | 0 | 130 | 114 | -62 | 19 | -217 | -83 |
| 2016 | -183 | -310 | 36 | 48 | 127 | 132 | 57 | 129 | -412 | 114 | 516 | -82 |
| 2017 | -131 | 113 | 211 | 186 | 192 | 136 | 203 | 210 | 102 | -67 | -152 | -387 |
| 2018 | 21 | -118 | 19 | 109 | 213 | 72 | 254 | 240 | 195 | 98 | 329 | 148 |
| 2019 | 352 | 277 | 246 | 256 | 196 | 204 | 168 | 179 | 424 | 400 | 285 | 371 |
| 2020 | 451 | 379 | 342 | 348 | 219 | 200 | 194 | 172 | 220 | 225 | 173 | 369 |
| 2021 | 429 | 401 | 359 | 293 | 201 | 184 | 195 | 189 | 220 | 292 | 325 | 358 |
| 2022 | 458 | 429 | 430 | 357 | 268 | 215 | 186 | 194 | 222 | 289 | 331 | 458 |
| 2023 | 490 | 377 | 497 | 326 | 287 | 246 | 236 | 347 | 274 | 422 | 418 | 506 |
| 2024 | 520 | |||||||||||
| - = No Data Reported; -- = Not Applicable; NA = Not Available; W = Withheld to avoid disclosure of individual company data. |
| Release Date: 3/29/2024 |
| Next Release Date: 4/30/2024 |