|
Download Data (XLS File) |
|
||||||||
|
||||||||
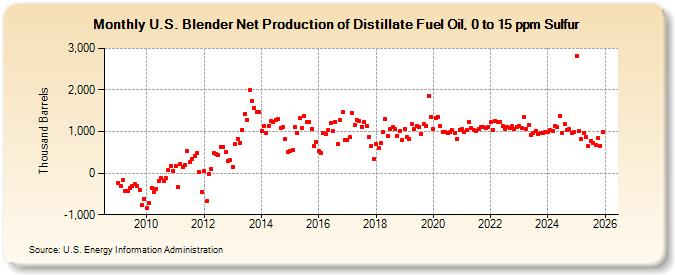
| U.S. Blender Net Production of Distillate Fuel Oil, 0 to 15 ppm Sulfur (Thousand Barrels) | ||||||||
| Year | Jan | Feb | Mar | Apr | May | Jun | Jul | Aug | Sep | Oct | Nov | Dec |
|---|---|---|---|---|---|---|---|---|---|---|---|---|
| 2009 | -242 | -317 | -173 | -430 | -438 | -359 | -321 | -269 | -318 | -403 | -777 | -634 |
| 2010 | -843 | -730 | -351 | -462 | -371 | -187 | -107 | -181 | -120 | 67 | 169 | 47 |
| 2011 | 160 | -335 | 231 | 149 | 203 | 530 | 258 | 348 | 409 | 477 | 33 | -448 |
| 2012 | 53 | -679 | -17 | 91 | 477 | 467 | 425 | 630 | 633 | 500 | 284 | 309 |
| 2013 | 149 | 693 | 822 | 723 | 1,036 | 1,433 | 1,284 | 1,993 | 1,745 | 1,574 | 1,459 | 1,461 |
| 2014 | 1,021 | 1,128 | 969 | 1,143 | 1,249 | 1,229 | 1,289 | 1,307 | 1,074 | 1,105 | 819 | 510 |
| 2015 | 540 | 552 | 1,106 | 976 | 1,320 | 1,089 | 1,366 | 1,229 | 1,232 | 1,068 | 661 | 739 |
| 2016 | 522 | 496 | 957 | 939 | 1,034 | 1,195 | 1,019 | 1,236 | 698 | 1,270 | 1,461 | 795 |
| 2017 | 788 | 862 | 1,443 | 1,163 | 1,289 | 1,258 | 1,118 | 1,229 | 1,137 | 876 | 652 | 331 |
| 2018 | 698 | 594 | 734 | 982 | 1,300 | 889 | 1,053 | 1,112 | 1,058 | 904 | 1,005 | 793 |
| 2019 | 1,059 | 865 | 810 | 1,193 | 1,054 | 1,145 | 1,114 | 946 | 1,181 | 1,144 | 1,859 | 1,358 |
| 2020 | 1,052 | 1,332 | 1,356 | 1,124 | 998 | 1,000 | 968 | 982 | 1,026 | 970 | 828 | 1,048 |
| 2021 | 1,057 | 987 | 1,030 | 1,231 | 1,084 | 1,032 | 1,021 | 1,054 | 1,121 | 1,115 | 1,077 | 1,103 |
| 2022 | 1,222 | 1,039 | 1,263 | 1,241 | 1,234 | 1,125 | 1,062 | 1,106 | 1,086 | 1,125 | 1,050 | 1,121 |
| 2023 | 1,124 | 1,054 | 1,339 | 1,195 | 1,285 | 1,129 | 1,016 | 1,182 | 1,161 | 1,077 | 1,072 | 1,048 |
| 2024 | 1,034 | 1,031 | ||||||||||
| - = No Data Reported; -- = Not Applicable; NA = Not Available; W = Withheld to avoid disclosure of individual company data. |
| Release Date: 4/30/2024 |
| Next Release Date: 5/31/2024 |