|
Download Data (XLS File) |
|
||||||||
|
||||||||
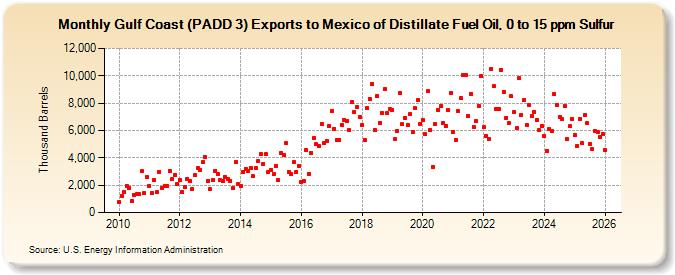
| Gulf Coast (PADD 3) Exports to Mexico of Distillate Fuel Oil, 0 to 15 ppm Sulfur (Thousand Barrels) | ||||||||
| Year | Jan | Feb | Mar | Apr | May | Jun | Jul | Aug | Sep | Oct | Nov | Dec |
|---|---|---|---|---|---|---|---|---|---|---|---|---|
| 2010 | 758 | 1,233 | 1,492 | 1,961 | 1,773 | 830 | 1,296 | 1,331 | 1,322 | 3,024 | 1,408 | 2,583 |
| 2011 | 1,968 | 1,459 | 2,380 | 1,504 | 2,977 | 1,817 | 1,961 | 1,945 | 3,069 | 2,423 | 2,765 | 2,070 |
| 2012 | 2,353 | 1,496 | 1,838 | 2,470 | 2,292 | 1,742 | 2,723 | 3,256 | 3,133 | 3,664 | 4,051 | 2,334 |
| 2013 | 1,686 | 2,387 | 3,071 | 2,827 | 2,390 | 2,316 | 2,616 | 2,464 | 2,315 | 1,792 | 3,731 | 2,077 |
| 2014 | 1,936 | 2,956 | 3,200 | 3,027 | 3,272 | 2,646 | 3,252 | 3,781 | 4,278 | 3,556 | 4,273 | 2,982 |
| 2015 | 3,090 | 2,799 | 3,421 | 2,378 | 4,388 | 4,240 | 5,052 | 2,953 | 2,815 | 3,705 | 2,966 | 3,370 |
| 2016 | 2,260 | 2,321 | 4,570 | 2,809 | 4,348 | 5,467 | 4,985 | 4,839 | 6,499 | 5,062 | 5,264 | 6,320 |
| 2017 | 7,407 | 6,144 | 5,331 | 5,304 | 6,425 | 6,778 | 6,690 | 6,017 | 8,087 | 7,336 | 7,731 | 6,986 |
| 2018 | 6,389 | 5,332 | 7,613 | 8,303 | 9,393 | 6,027 | 8,509 | 6,566 | 7,257 | 9,036 | 7,256 | 7,539 |
| 2019 | 7,507 | 5,403 | 5,992 | 8,743 | 6,441 | 6,908 | 6,372 | 7,182 | 5,853 | 7,641 | 8,245 | 6,504 |
| 2020 | 6,749 | 5,715 | 8,873 | 6,024 | 3,356 | 6,465 | 7,532 | 7,758 | 6,514 | 6,317 | 7,478 | 8,733 |
| 2021 | 5,924 | 5,290 | 7,389 | 8,371 | 10,038 | 10,047 | 7,077 | 8,699 | 6,288 | 6,674 | 7,790 | 9,959 |
| 2022 | 6,231 | 5,625 | 5,376 | 10,501 | 9,230 | 7,544 | 7,594 | 10,445 | 8,843 | 6,937 | 6,516 | 8,491 |
| 2023 | 7,643 | 6,294 | 10,327 | 7,301 | 8,114 | 6,349 | 8,320 | 6,552 | 7,479 | 6,753 | 5,847 | 6,320 |
| 2024 | 5,586 | |||||||||||
| - = No Data Reported; -- = Not Applicable; NA = Not Available; W = Withheld to avoid disclosure of individual company data. |
| Release Date: 3/29/2024 |
| Next Release Date: 4/30/2024 |