|
Download Data (XLS File) |
|
|||||
|
|||||
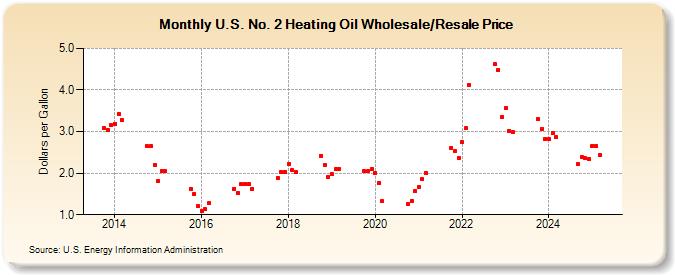
| U.S. No. 2 Heating Oil Wholesale/Resale Price (Dollars per Gallon) | |||||
| Year | Jan | Feb | Mar | Apr | May | Jun | Jul | Aug | Sep | Oct | Nov | Dec |
|---|---|---|---|---|---|---|---|---|---|---|---|---|
| 2013 | 3.075 | 3.046 | 3.155 | |||||||||
| 2014 | 3.192 | 3.418 | 3.286 | 2.644 | 2.646 | 2.200 | ||||||
| 2015 | 1.806 | 2.056 | 2.040 | 1.622 | 1.500 | 1.205 | ||||||
| 2016 | 1.085 | 1.127 | 1.275 | 1.627 | 1.527 | 1.735 | ||||||
| 2017 | 1.740 | 1.731 | 1.619 | 1.893 | 2.023 | 2.033 | ||||||
| 2018 | 2.215 | 2.069 | 2.021 | 2.422 | 2.199 | 1.911 | ||||||
| 2019 | 1.976 | 2.088 | 2.111 | 2.046 | 2.041 | 2.100 | ||||||
| 2020 | 1.998 | 1.767 | 1.321 | 1.253 | 1.332 | 1.569 | ||||||
| 2021 | 1.672 | 1.857 | 2.012 | 2.614 | 2.525 | 2.365 | ||||||
| 2022 | 2.738 | 3.078 | 4.125 | 4.614 | 4.476 | 3.344 | ||||||
| 2023 | 3.561 | 3.018 | 2.979 | 3.299 | 3.073 | 2.825 | ||||||
| 2024 | 2.818 | 2.954 | 2.858 | |||||||||
| - = No Data Reported; -- = Not Applicable; NA = Not Available; W = Withheld to avoid disclosure of individual company data. |
| Release Date: 4/17/2024 |
| Next Release Date: 4/24/2024 |