|
Download Data (XLS File) |
|
|||||
|
|||||
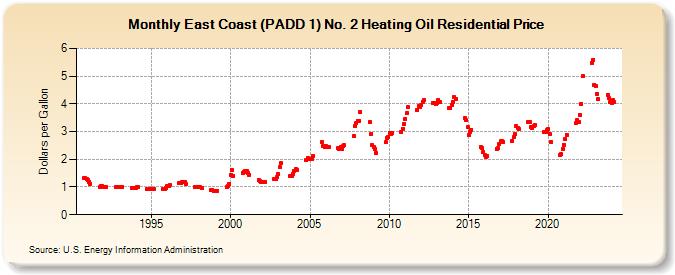
| East Coast (PADD 1) No. 2 Heating Oil Residential Price (Dollars per Gallon) | |||||
| Year | Jan | Feb | Mar | Apr | May | Jun | Jul | Aug | Sep | Oct | Nov | Dec |
|---|---|---|---|---|---|---|---|---|---|---|---|---|
| 1990 | 1.322 | 1.311 | 1.285 | |||||||||
| 1991 | 1.243 | 1.197 | 1.112 | 0.985 | 1.033 | 1.032 | ||||||
| 1992 | 0.999 | 0.998 | 0.988 | 0.986 | 0.998 | 0.991 | ||||||
| 1993 | 0.994 | 0.995 | 0.999 | NA | 0.953 | 0.959 | 0.948 | |||||
| 1994 | 0.965 | 1.013 | 0.997 | 0.913 | 0.921 | 0.929 | ||||||
| 1995 | 0.939 | 0.943 | 0.939 | 0.911 | 0.924 | 0.961 | ||||||
| 1996 | 1.031 | 1.045 | 1.070 | 1.137 | 1.145 | 1.170 | ||||||
| 1997 | 1.177 | 1.164 | 1.118 | 0.996 | 1.007 | 1.015 | ||||||
| 1998 | 1.008 | 0.997 | 0.978 | 0.876 | 0.878 | 0.868 | ||||||
| 1999 | 0.873 | 0.873 | 0.869 | 1.009 | 1.043 | 1.125 | ||||||
| 2000 | 1.445 | 1.614 | 1.398 | 1.506 | 1.549 | 1.578 | ||||||
| 2001 | 1.561 | 1.506 | 1.447 | 1.246 | 1.200 | 1.170 | ||||||
| 2002 | 1.183 | 1.179 | 1.191 | 1.272 | 1.283 | 1.347 | ||||||
| 2003 | 1.470 | 1.707 | 1.861 | 1.386 | 1.412 | 1.478 | ||||||
| 2004 | 1.595 | 1.647 | 1.624 | 1.959 | 2.049 | 1.995 | ||||||
| 2005 | 1.998 | 2.021 | 2.123 | 2.623 | 2.462 | 2.439 | ||||||
| 2006 | 2.466 | 2.437 | 2.445 | 2.400 | 2.380 | 2.451 | ||||||
| 2007 | 2.387 | 2.464 | 2.503 | 2.848 | 3.208 | 3.315 | ||||||
| 2008 | 3.380 | 3.390 | 3.706 | 3.349 | 2.897 | 2.516 | ||||||
| 2009 | 2.446 | 2.365 | 2.229 | 2.614 | 2.764 | 2.792 | ||||||
| 2010 | 2.960 | 2.896 | 2.940 | 2.970 | 3.103 | 3.279 | ||||||
| 2011 | 3.457 | 3.660 | 3.893 | 3.779 | 3.930 | 3.881 | ||||||
| 2012 | 3.959 | 4.077 | 4.132 | 4.021 | 4.018 | 3.994 | ||||||
| 2013 | 4.027 | 4.154 | 4.063 | 3.835 | 3.840 | 3.973 | ||||||
| 2014 | 4.070 | 4.242 | 4.185 | 3.487 | 3.399 | 3.162 | ||||||
| 2015 | 2.885 | 2.986 | 3.071 | 2.430 | 2.402 | 2.250 | ||||||
| 2016 | 2.138 | 2.098 | 2.125 | 2.373 | 2.394 | 2.551 | ||||||
| 2017 | 2.642 | 2.653 | 2.616 | 2.672 | 2.807 | 2.895 | ||||||
| 2018 | 3.189 | 3.141 | 3.084 | 3.352 | 3.327 | 3.168 | ||||||
| 2019 | 3.146 | 3.208 | 3.228 | 2.974 | 2.995 | 3.051 | ||||||
| 2020 | 3.092 | 2.926 | 2.625 | 2.146 | 2.190 | 2.381 | ||||||
| 2021 | 2.531 | 2.715 | 2.882 | 3.311 | 3.399 | 3.356 | ||||||
| 2022 | 3.598 | 3.987 | 4.992 | 5.484 | 5.585 | 4.684 | ||||||
| 2023 | 4.656 | 4.351 | 4.174 | 4.330 | 4.194 | 4.058 | ||||||
| 2024 | 4.023 | 4.124 | 4.064 | |||||||||
| - = No Data Reported; -- = Not Applicable; NA = Not Available; W = Withheld to avoid disclosure of individual company data. |
| Release Date: 4/17/2024 |
| Next Release Date: 4/24/2024 |