|
Download Data (XLS File) |
|
||||||||
|
||||||||
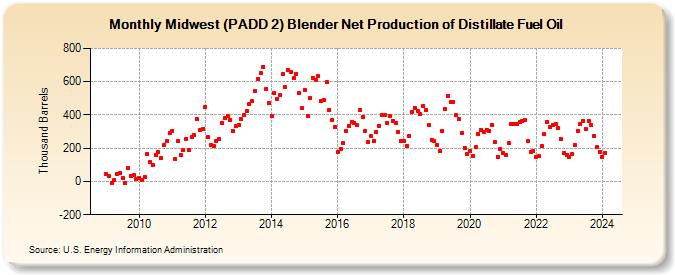
| Midwest (PADD 2) Blender Net Production of Distillate Fuel Oil (Thousand Barrels) | ||||||||
| Year | Jan | Feb | Mar | Apr | May | Jun | Jul | Aug | Sep | Oct | Nov | Dec |
|---|---|---|---|---|---|---|---|---|---|---|---|---|
| 2009 | 43 | 30 | -9 | 9 | 46 | 52 | 19 | -7 | 80 | 34 | 36 | 17 |
| 2010 | 18 | 11 | 24 | 168 | 117 | 98 | 158 | 176 | 143 | 221 | 242 | 294 |
| 2011 | 305 | 133 | 241 | 158 | 188 | 257 | 192 | 269 | 279 | 374 | 308 | 314 |
| 2012 | 449 | 265 | 221 | 213 | 244 | 258 | 354 | 380 | 396 | 371 | 306 | 331 |
| 2013 | 341 | 373 | 401 | 424 | 463 | 483 | 542 | 618 | 653 | 690 | 558 | 472 |
| 2014 | 395 | 531 | 496 | 521 | 644 | 569 | 672 | 659 | 620 | 647 | 529 | 442 |
| 2015 | 550 | 395 | 502 | 624 | 612 | 631 | 481 | 492 | 597 | 432 | 370 | 328 |
| 2016 | 179 | 196 | 231 | 304 | 334 | 359 | 354 | 338 | 431 | 386 | 305 | 236 |
| 2017 | 273 | 246 | 298 | 334 | 399 | 399 | 351 | 394 | 365 | 352 | 298 | 245 |
| 2018 | 246 | 215 | 274 | 419 | 444 | 421 | 405 | 454 | 429 | 337 | 249 | 241 |
| 2019 | 219 | 181 | 306 | 435 | 514 | 478 | 476 | 399 | 377 | 290 | 203 | 165 |
| 2020 | 181 | 155 | 207 | 288 | 311 | 296 | 311 | 305 | 342 | 237 | 149 | 197 |
| 2021 | 171 | 157 | 229 | 345 | 348 | 345 | 359 | 364 | 368 | 245 | 178 | 183 |
| 2022 | 149 | 153 | 216 | 285 | 359 | 329 | 338 | 344 | 323 | 256 | 172 | 162 |
| 2023 | 149 | 164 | 218 | 305 | 346 | 361 | 318 | 365 | 339 | 274 | 205 | 177 |
| 2024 | 146 | |||||||||||
| - = No Data Reported; -- = Not Applicable; NA = Not Available; W = Withheld to avoid disclosure of individual company data. |
| Release Date: 3/29/2024 |
| Next Release Date: 4/30/2024 |