|
Download Data (XLS File) |
|
||||||||
|
||||||||
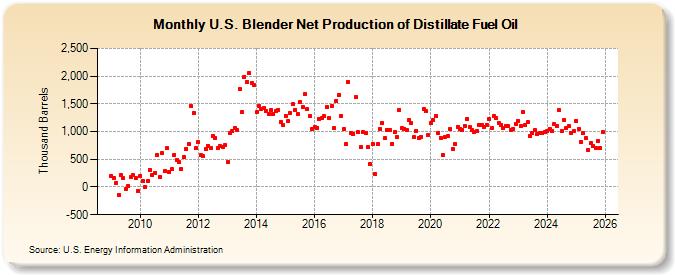
| U.S. Blender Net Production of Distillate Fuel Oil (Thousand Barrels) | ||||||||
| Year | Jan | Feb | Mar | Apr | May | Jun | Jul | Aug | Sep | Oct | Nov | Dec |
|---|---|---|---|---|---|---|---|---|---|---|---|---|
| 2009 | 196 | 160 | 76 | -136 | 212 | 155 | -35 | 20 | 176 | 208 | 154 | -70 |
| 2010 | 205 | 117 | 0 | 101 | 312 | 208 | 256 | 581 | 186 | 605 | 285 | 697 |
| 2011 | 263 | 316 | 585 | 486 | 445 | 323 | 539 | 685 | 773 | 1,459 | 1,338 | 702 |
| 2012 | 813 | 573 | 551 | 680 | 744 | 702 | 925 | 888 | 696 | 740 | 718 | 755 |
| 2013 | 445 | 971 | 1,001 | 1,059 | 1,024 | 1,768 | 1,354 | 1,990 | 1,902 | 2,058 | 1,869 | 1,831 |
| 2014 | 1,347 | 1,469 | 1,411 | 1,422 | 1,374 | 1,325 | 1,387 | 1,324 | 1,371 | 1,389 | 1,177 | 1,118 |
| 2015 | 1,288 | 1,189 | 1,335 | 1,491 | 1,391 | 1,317 | 1,526 | 1,446 | 1,673 | 1,402 | 1,278 | 1,046 |
| 2016 | 1,088 | 1,065 | 1,231 | 1,248 | 1,280 | 1,434 | 1,241 | 1,462 | 1,065 | 1,555 | 1,666 | 1,282 |
| 2017 | 1,038 | 774 | 1,897 | 975 | 962 | 1,622 | 987 | 713 | 996 | 974 | 718 | 415 |
| 2018 | 777 | 233 | 774 | 1,046 | 1,150 | 876 | 1,034 | 1,036 | 784 | 986 | 903 | 1,392 |
| 2019 | 1,067 | 1,053 | 1,036 | 1,210 | 1,154 | 893 | 1,018 | 886 | 909 | 1,414 | 1,362 | 944 |
| 2020 | 1,152 | 1,204 | 1,277 | 974 | 889 | 580 | 908 | 914 | 1,049 | 686 | 781 | 1,087 |
| 2021 | 1,054 | 1,028 | 1,103 | 1,231 | 1,075 | 1,024 | 990 | 1,002 | 1,125 | 1,121 | 1,085 | 1,120 |
| 2022 | 1,224 | 1,056 | 1,273 | 1,244 | 1,162 | 1,126 | 1,059 | 1,106 | 1,094 | 1,030 | 1,053 | 1,132 |
| 2023 | 1,196 | 1,099 | 1,355 | 1,113 | 1,172 | 927 | 980 | 1,020 | 962 | 981 | 972 | 994 |
| 2024 | 1,051 | 1,039 | 1,011 | 1,132 | 1,081 | 1,133 | ||||||
| - = No Data Reported; -- = Not Applicable; NA = Not Available; W = Withheld to avoid disclosure of individual company data. |
| Release Date: 8/30/2024 |
| Next Release Date: 9/30/2024 |
Referring Pages: